
At a Glance
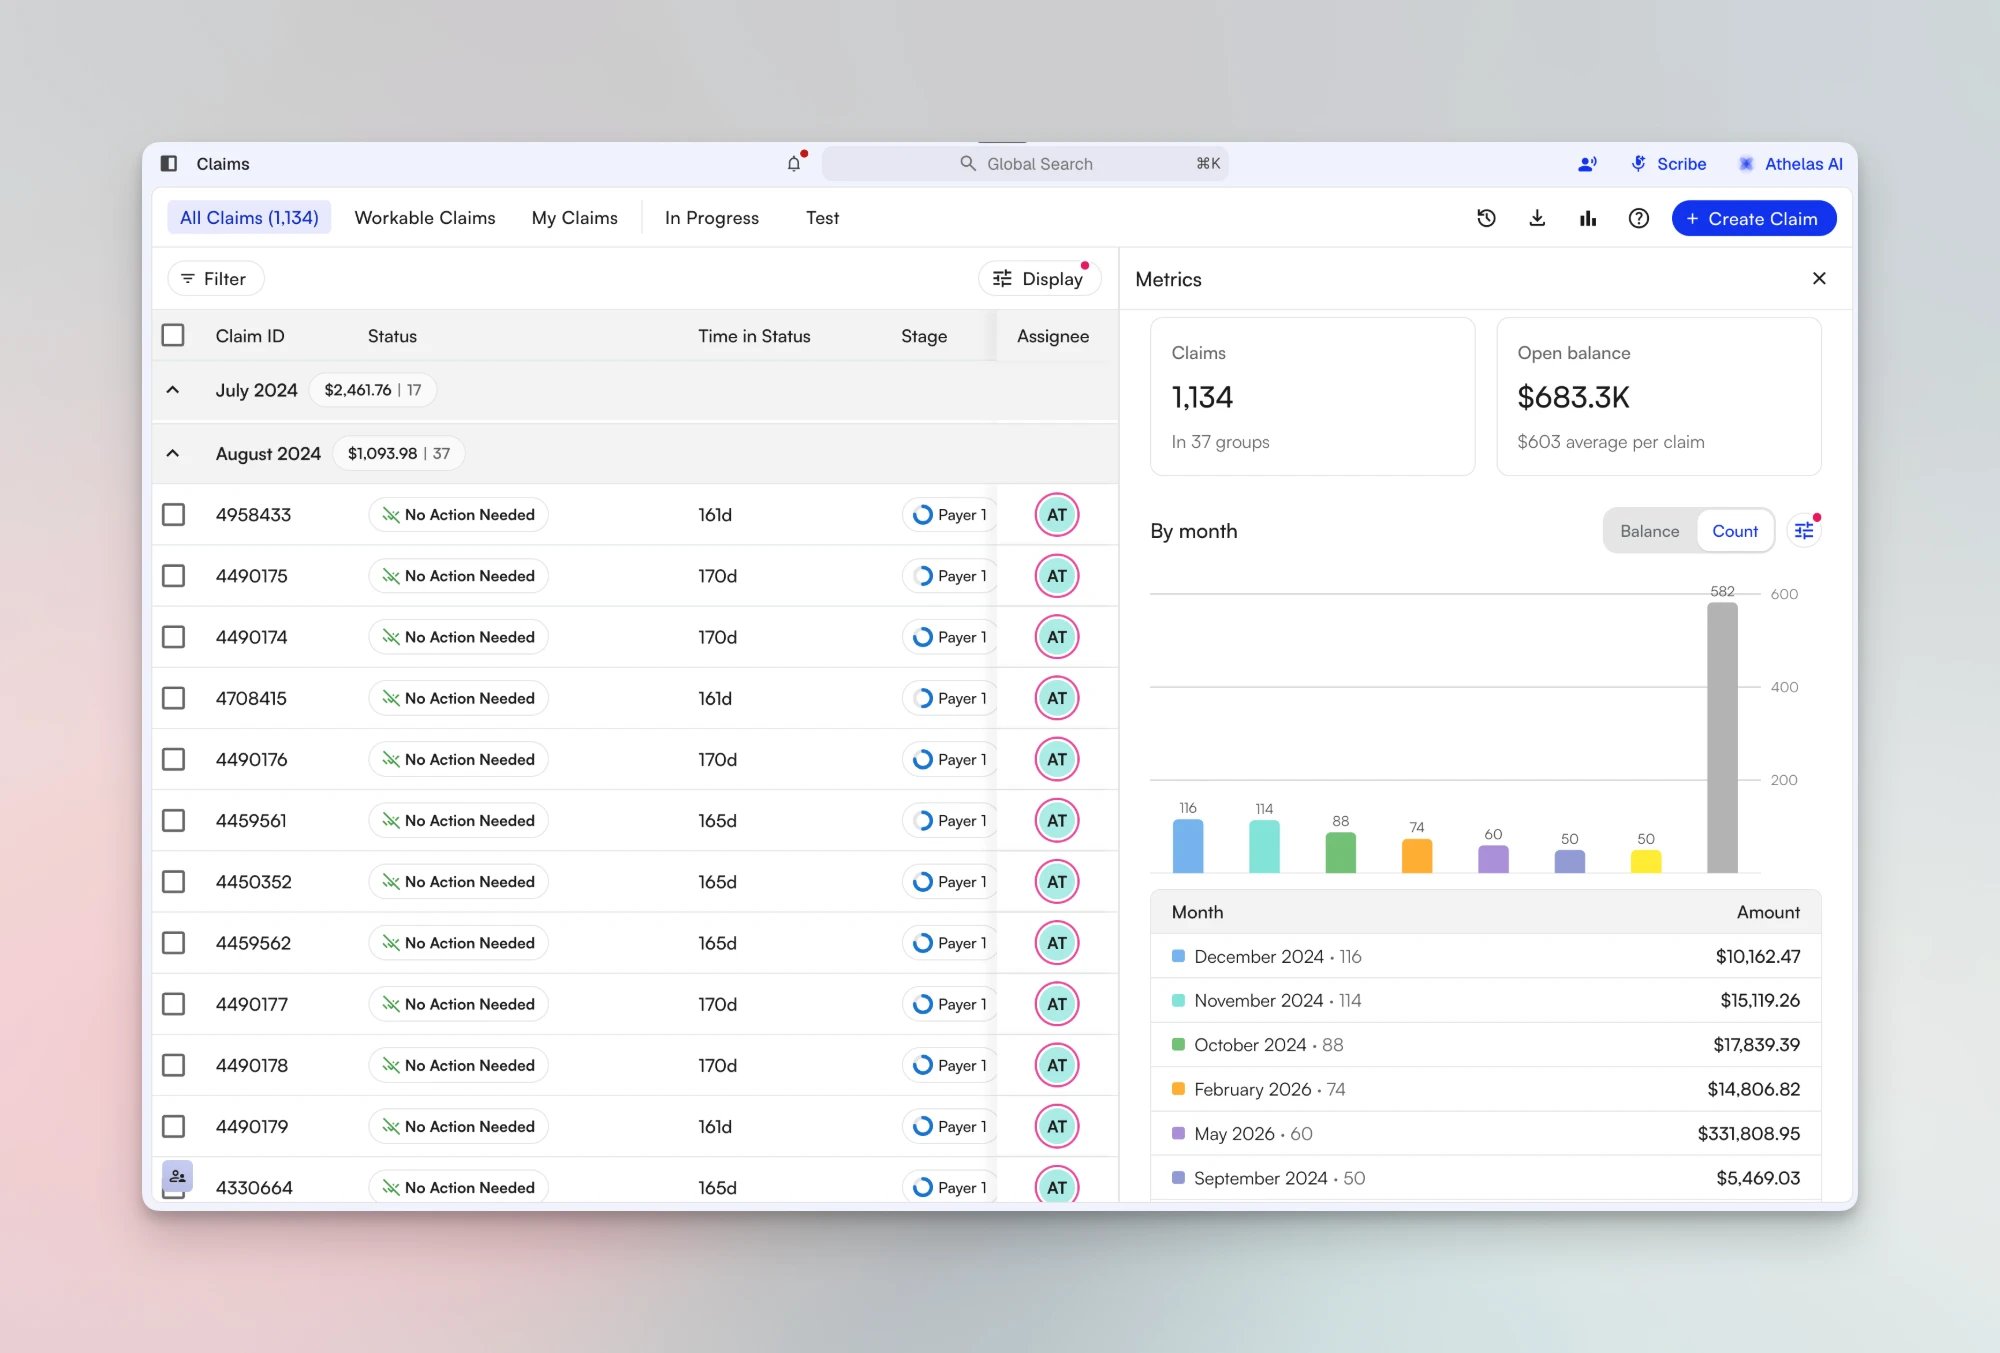
The Metrics panel shows how many claims are on your Claims Page list and how much open balance they carry. The panel opens beside the list and follows the list’s filters, so the numbers match the claims you see. When the list is grouped, the panel also breaks the totals down by group in a chart and a table.Beta: The Metrics panel is in beta. If you don’t see the Metrics button in the Claims Page header, ask your Athelas team to turn it on for your site.
Open the Panel
Click Metrics, the bar chart icon in the Claims Page header, near Create Claim. The panel opens on the right side of the list. To close it, click Metrics again or click the X at the top of the panel. If you leave the panel open, it is still open the next time you load the page in the same browser.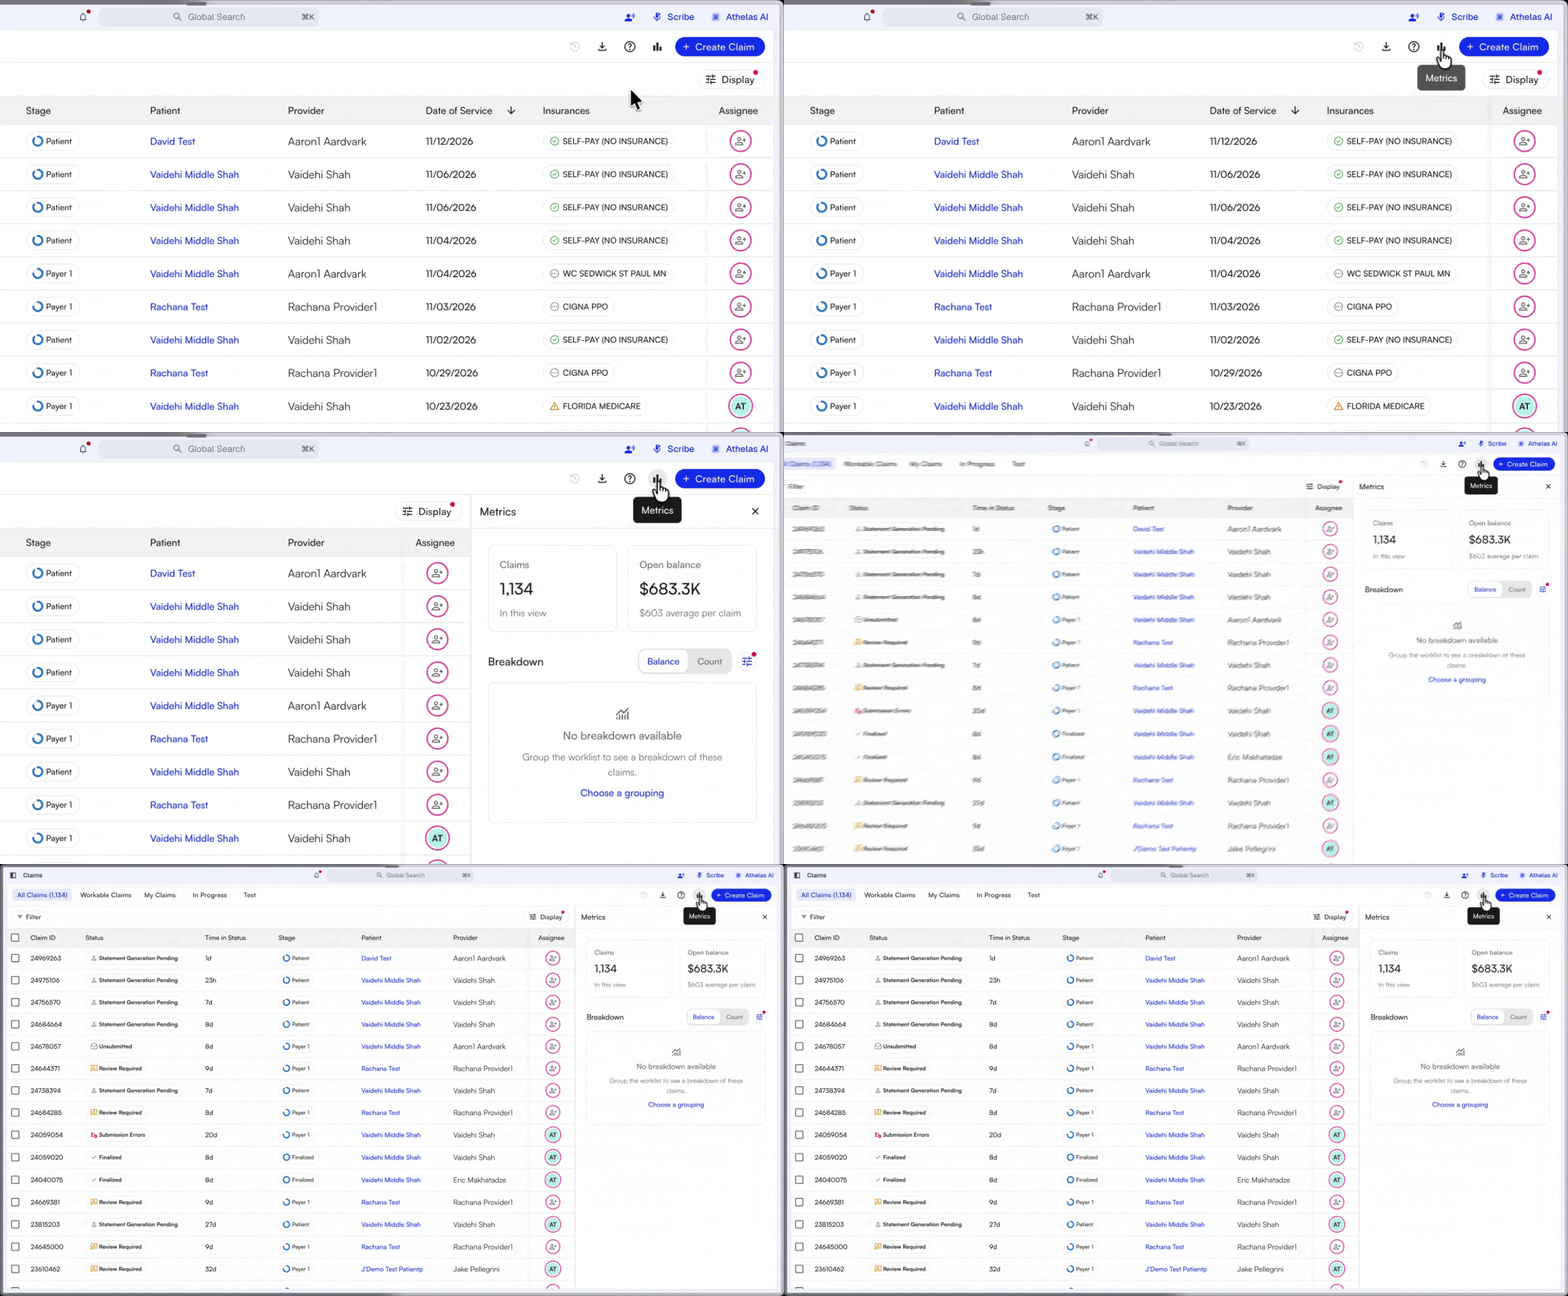
Read the Totals
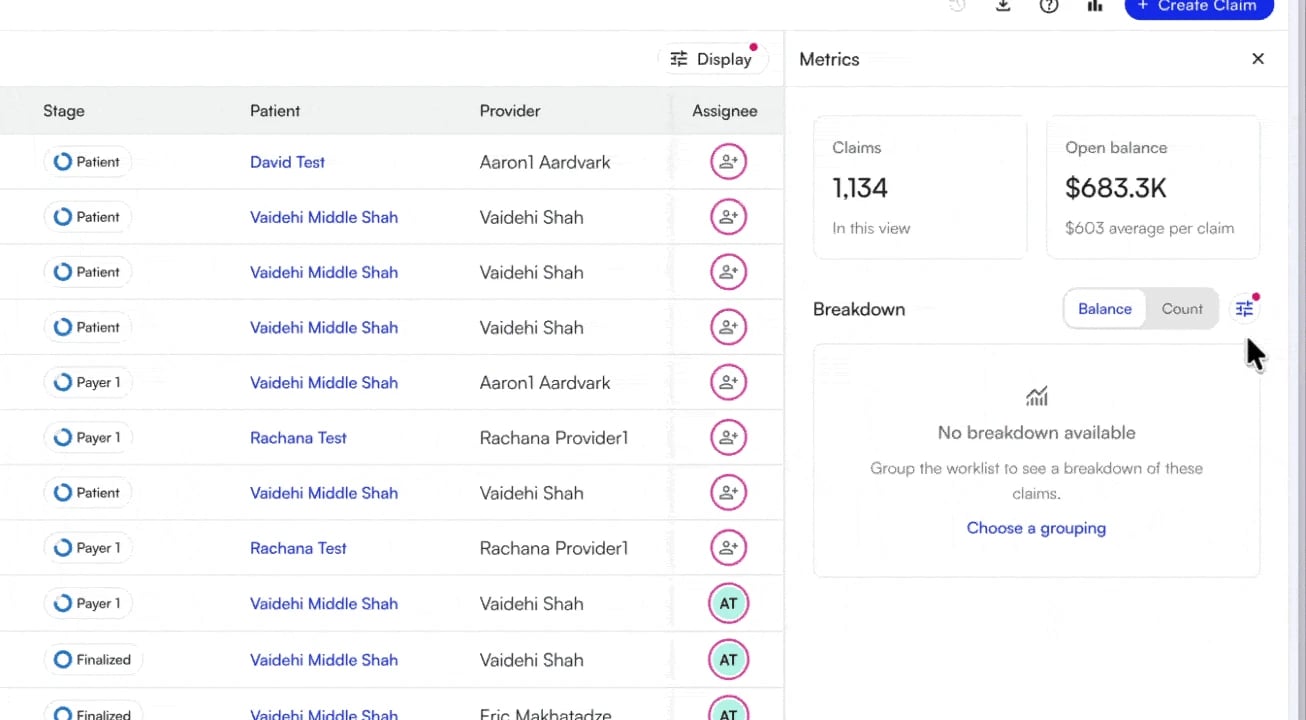
Two cards sit at the top of the panel.
When you change a filter or switch views, both cards update to match the list.
Break the Totals Down by Group
The Breakdown section needs a grouped list. If the list isn’t grouped, the section says No breakdown available. To see a breakdown:- Click Choose a grouping, or click the display settings icon next to the Balance and Count toggle.
- Under Grouping, choose a field, such as Month, Stage, Provider, or Primary Insurance.
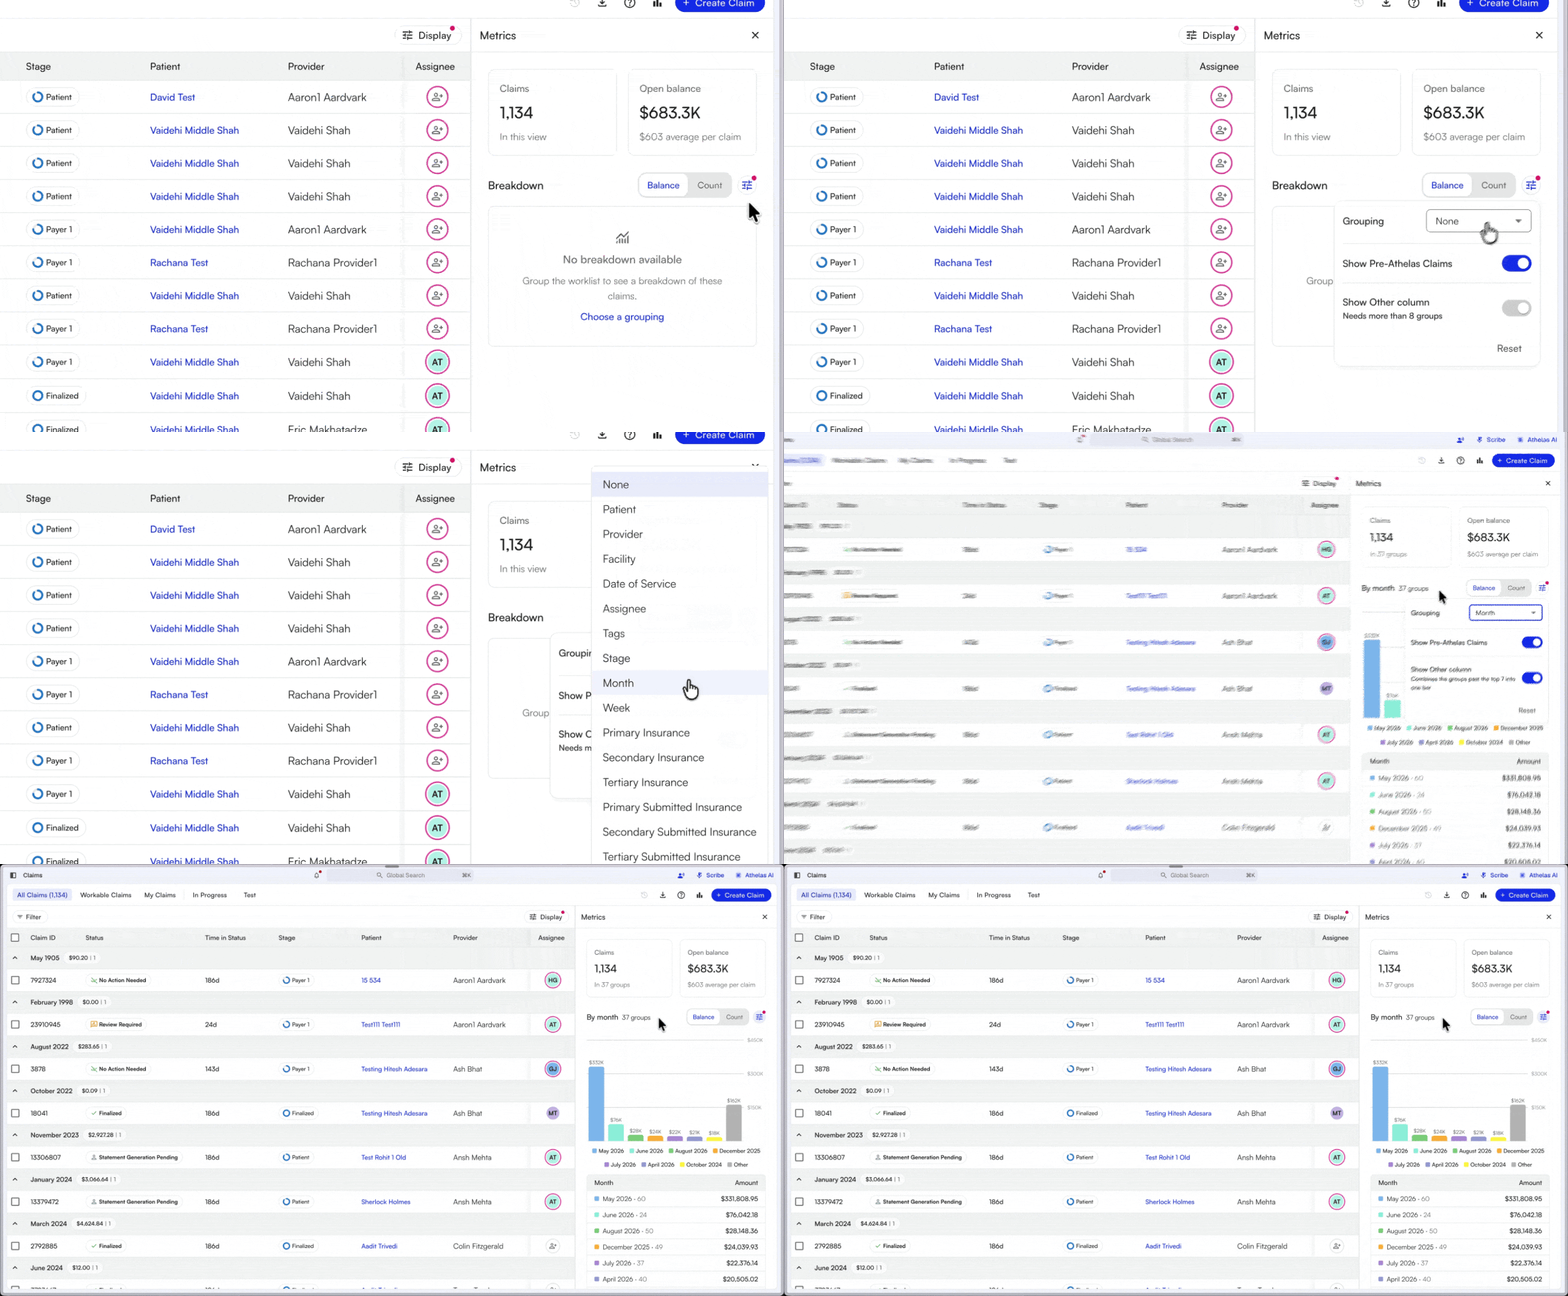
- The chart has one bar per group, with a color legend below it. Use the Balance and Count toggle to chart open balance or claim count. Hover over a bar to see its balance and claim count.
- The table lists every group with its claim count and its amount, which is the group’s open balance. The table shows 10 groups at first. A button at the bottom, such as Show 10 more (27 remaining), loads the next ones.
Filter the List from the Breakdown
Click a bar in the chart or a row in the table to filter the list to that group. For example, with the list grouped by month, click May 2026 to filter the list to claims with a date of service in May 2026. The totals cards update, and the other groups fade in the chart and the table. Click the same bar or row again to remove the filter.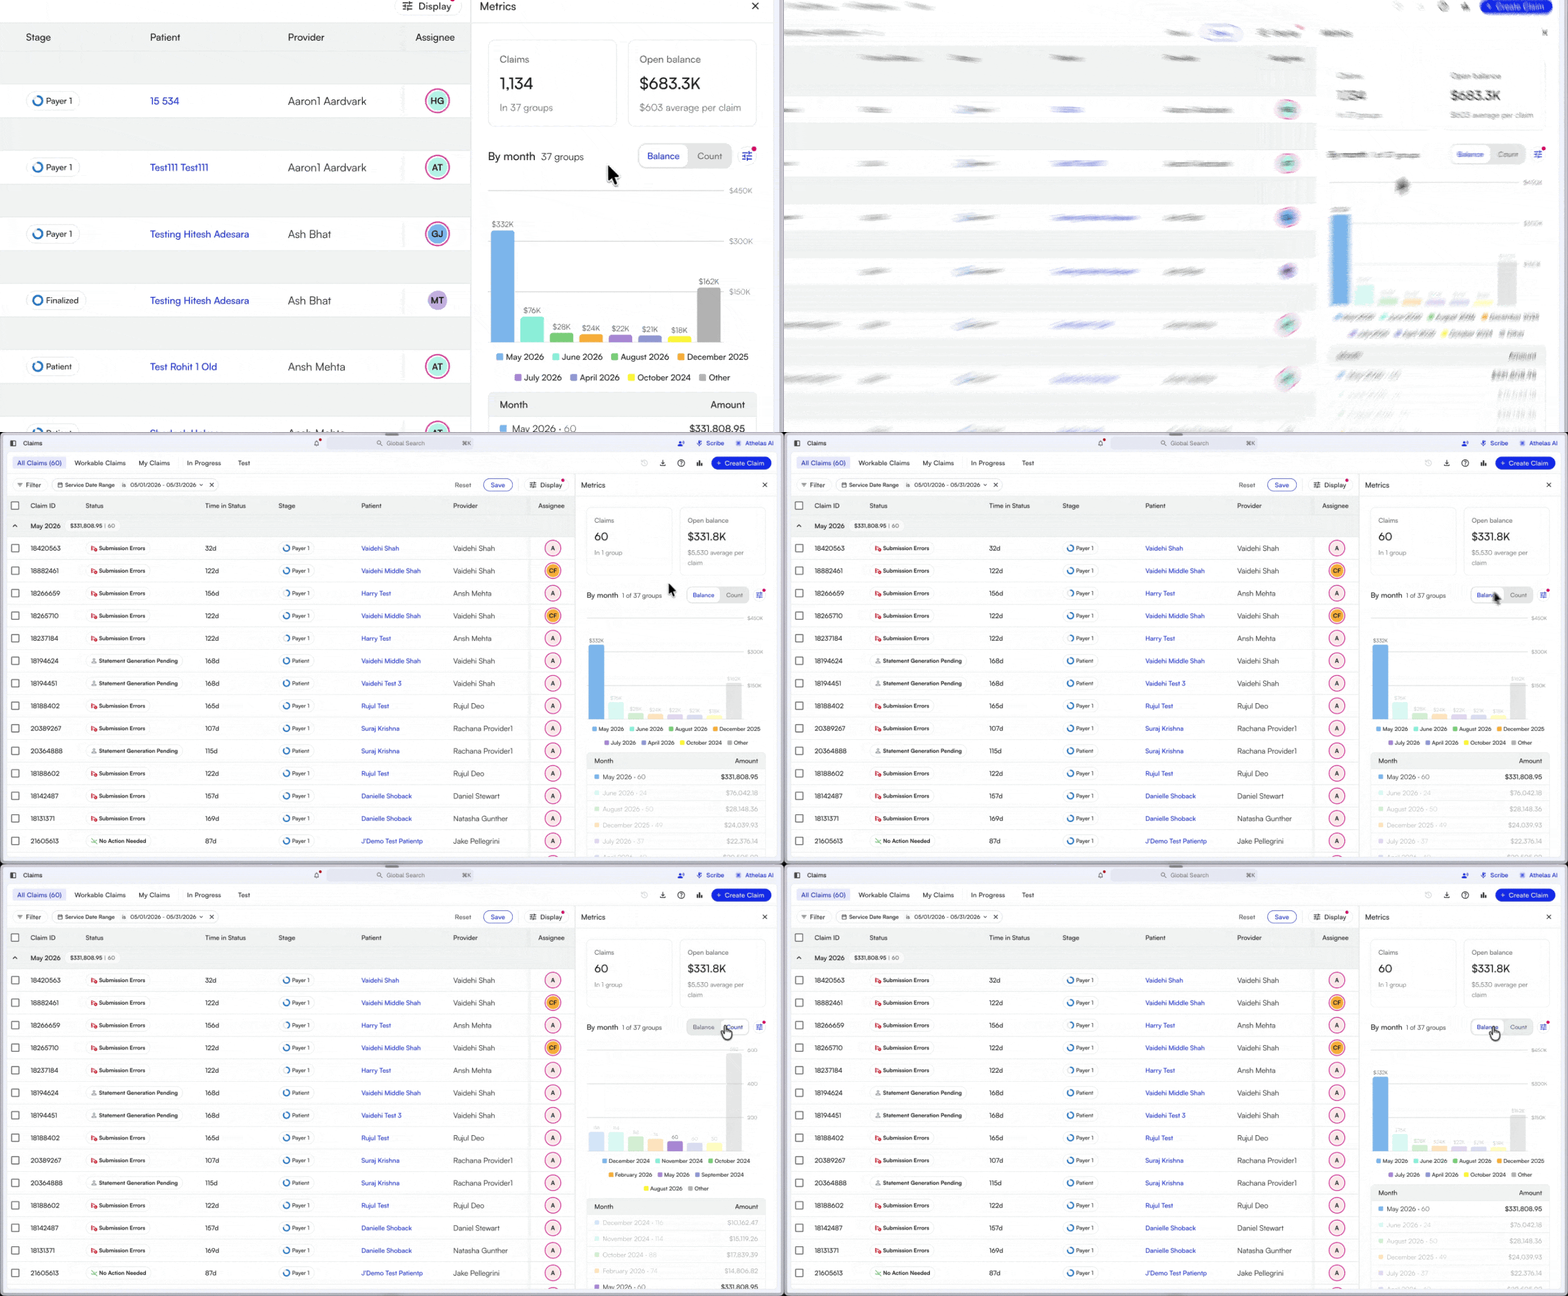
FAQ
Why don't the panel's numbers match a report?
Why don't the panel's numbers match a report?
The panel counts only the claims that match the list’s current filters and view. Check the filter bar and the selected view, then compare the report with the same filters.
Why does the breakdown say No breakdown available?
Why does the breakdown say No breakdown available?
The list isn’t grouped. Click Choose a grouping and pick a field under Grouping.
Why can't I click some bars or rows?
Why can't I click some bars or rows?
Some groups have no matching list filter, so their bars and rows aren’t clickable.
Does saving my view save the panel?
Does saving my view save the panel?
Saving a view saves its grouping, which the breakdown uses. The Show Other column setting is saved on your device, apart from the view.