At a Glance
The Revenue Analysis page in Insights allows you to view overall figures and trends in your practice’s collections, as well as the ability to filter results down to individual dates, payers, facilities, or providers. When you know exactly how much revenue is generated over specific time periods from either aggregate or individual providers, payers, and even CPT codes, you can optimize your practice’s resources, spot red flags more quickly, and improve the overall financial health of your organization.Features of the Page
By the Numbers
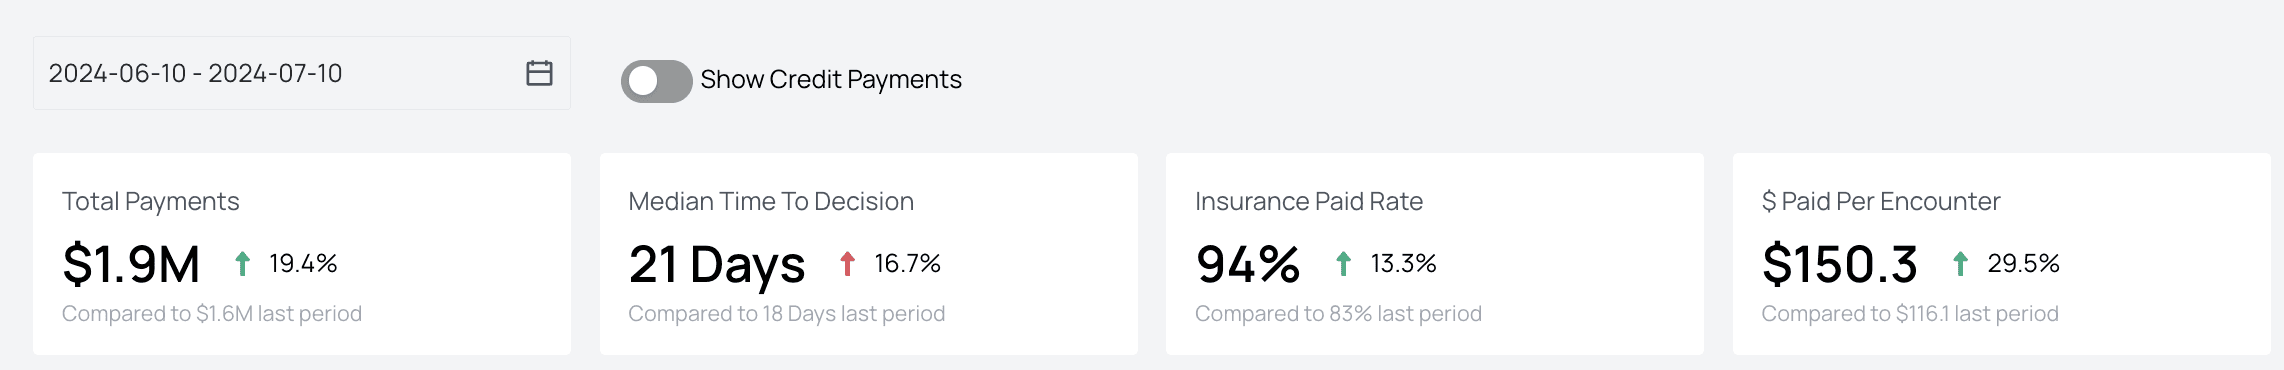
- Total Payments — This number shows the sum of all payments from payers and patients for the given date range. You can see how it compares both in percentage and real dollars to the previous period.
- Median Time to Decision — This number shows the median number of days from date of service to payer decision for a given time period. You can see how that time lapse compares to that of the previous period.
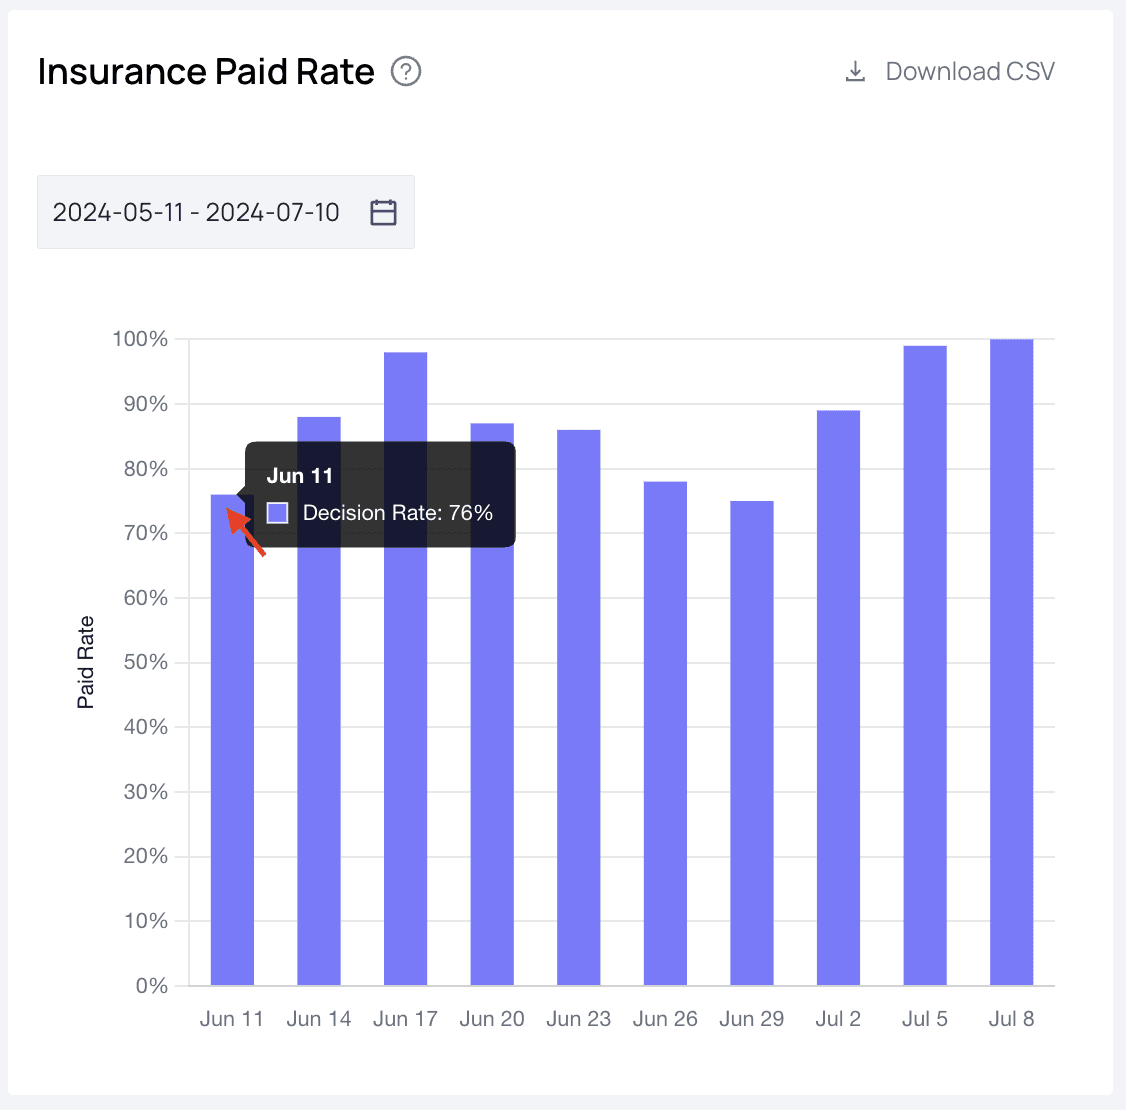
- Insurance Paid Rate — The higher the better. This number shows the percentage of claims successfully paid, as well as how that number compares with the previous period.
- $ Paid Per Encounter — The average dollar amount paid to your practice per patient encounter. Each section that follows has a ‘Download CSV’ button in the top right corner. Use this if you would like to analyze the raw data in Excel, Google Sheets, or some similar spreadsheet.
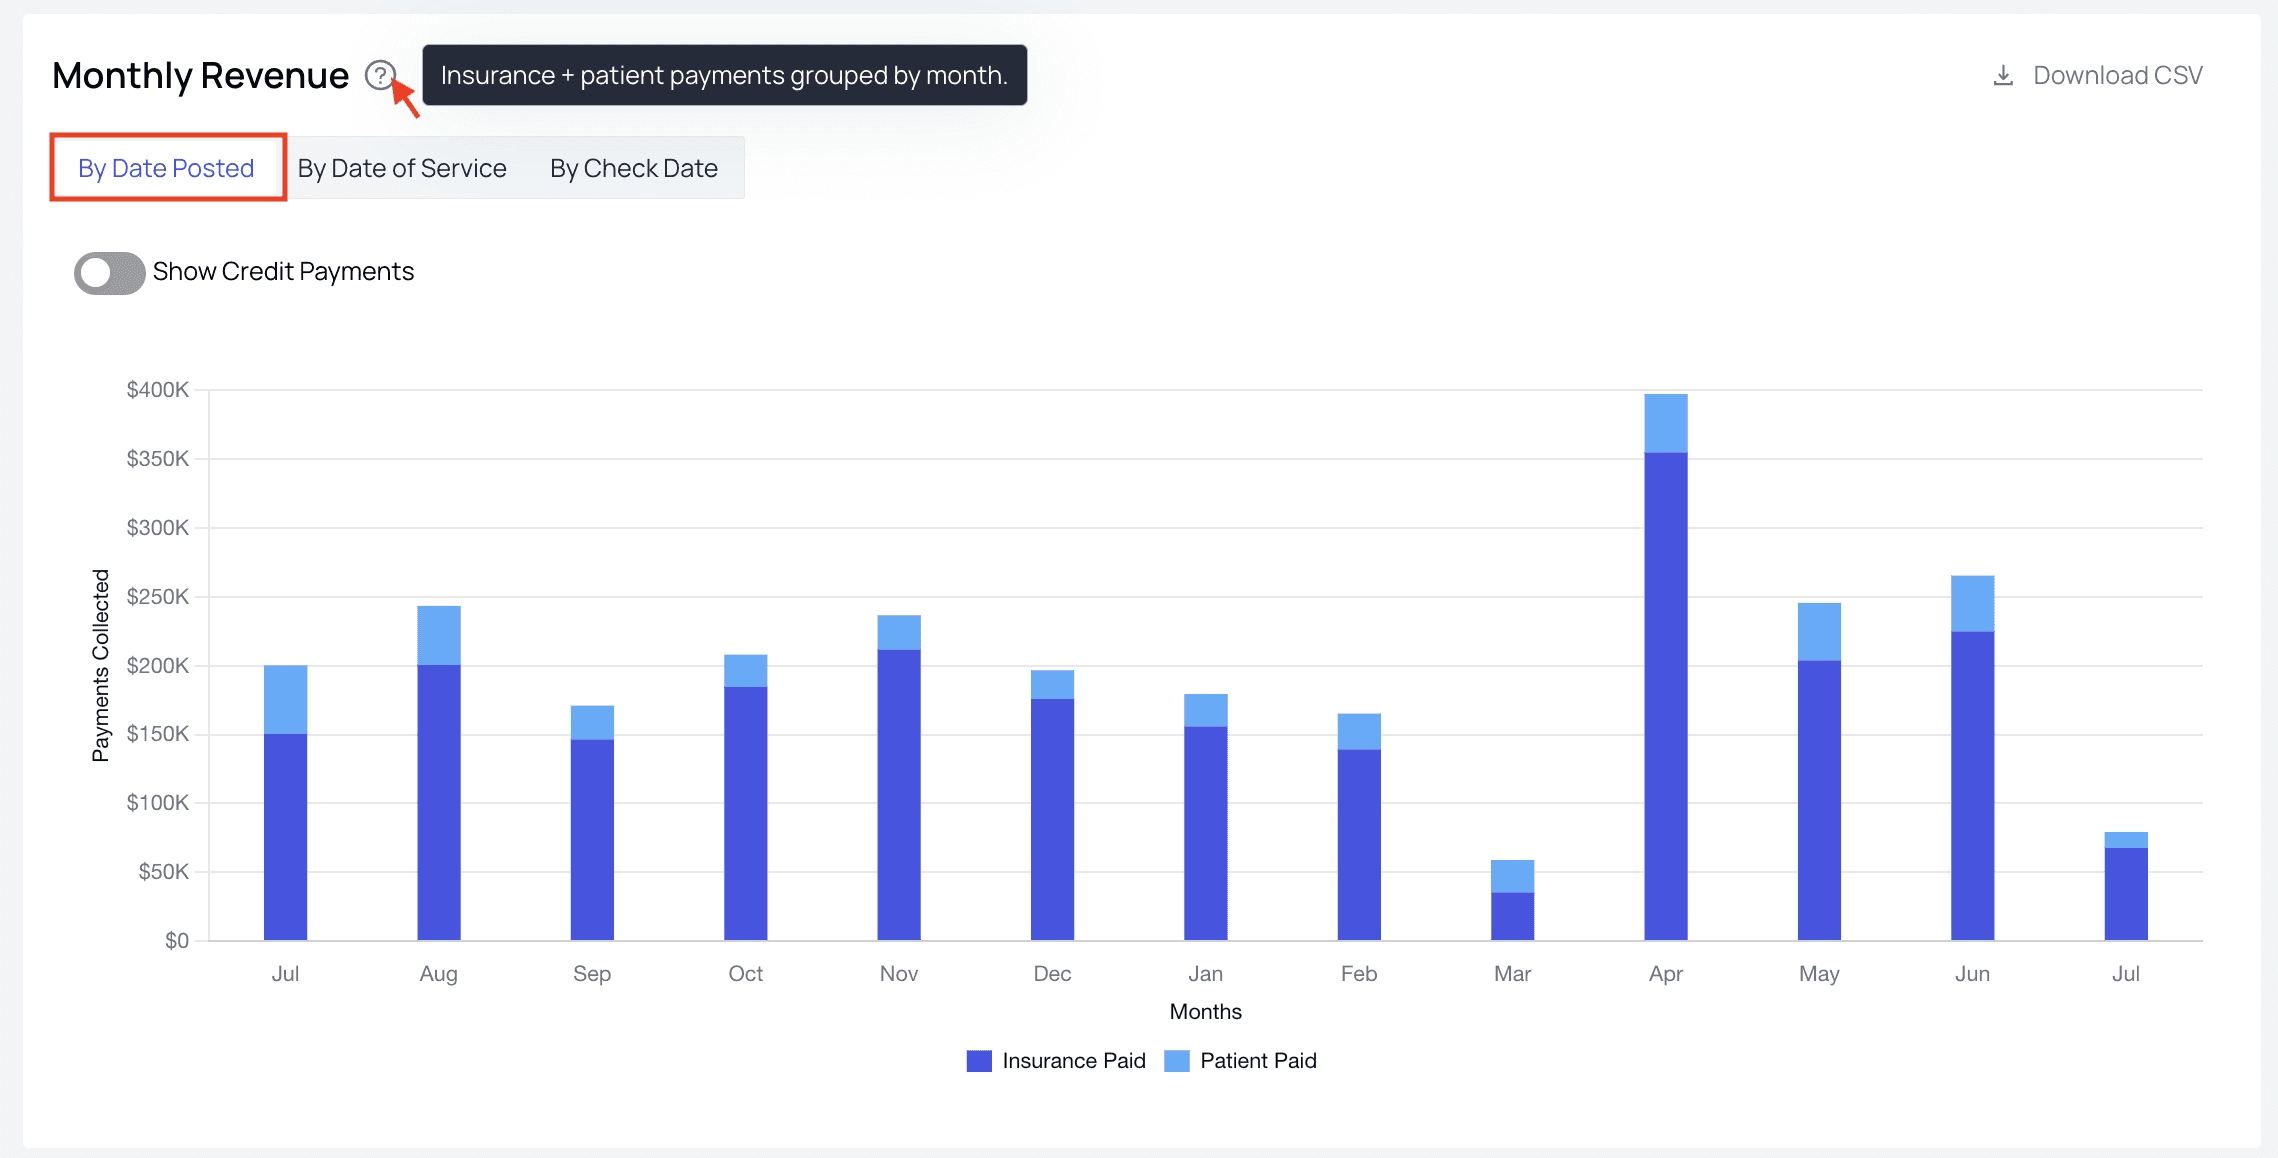
Monthly Revenue
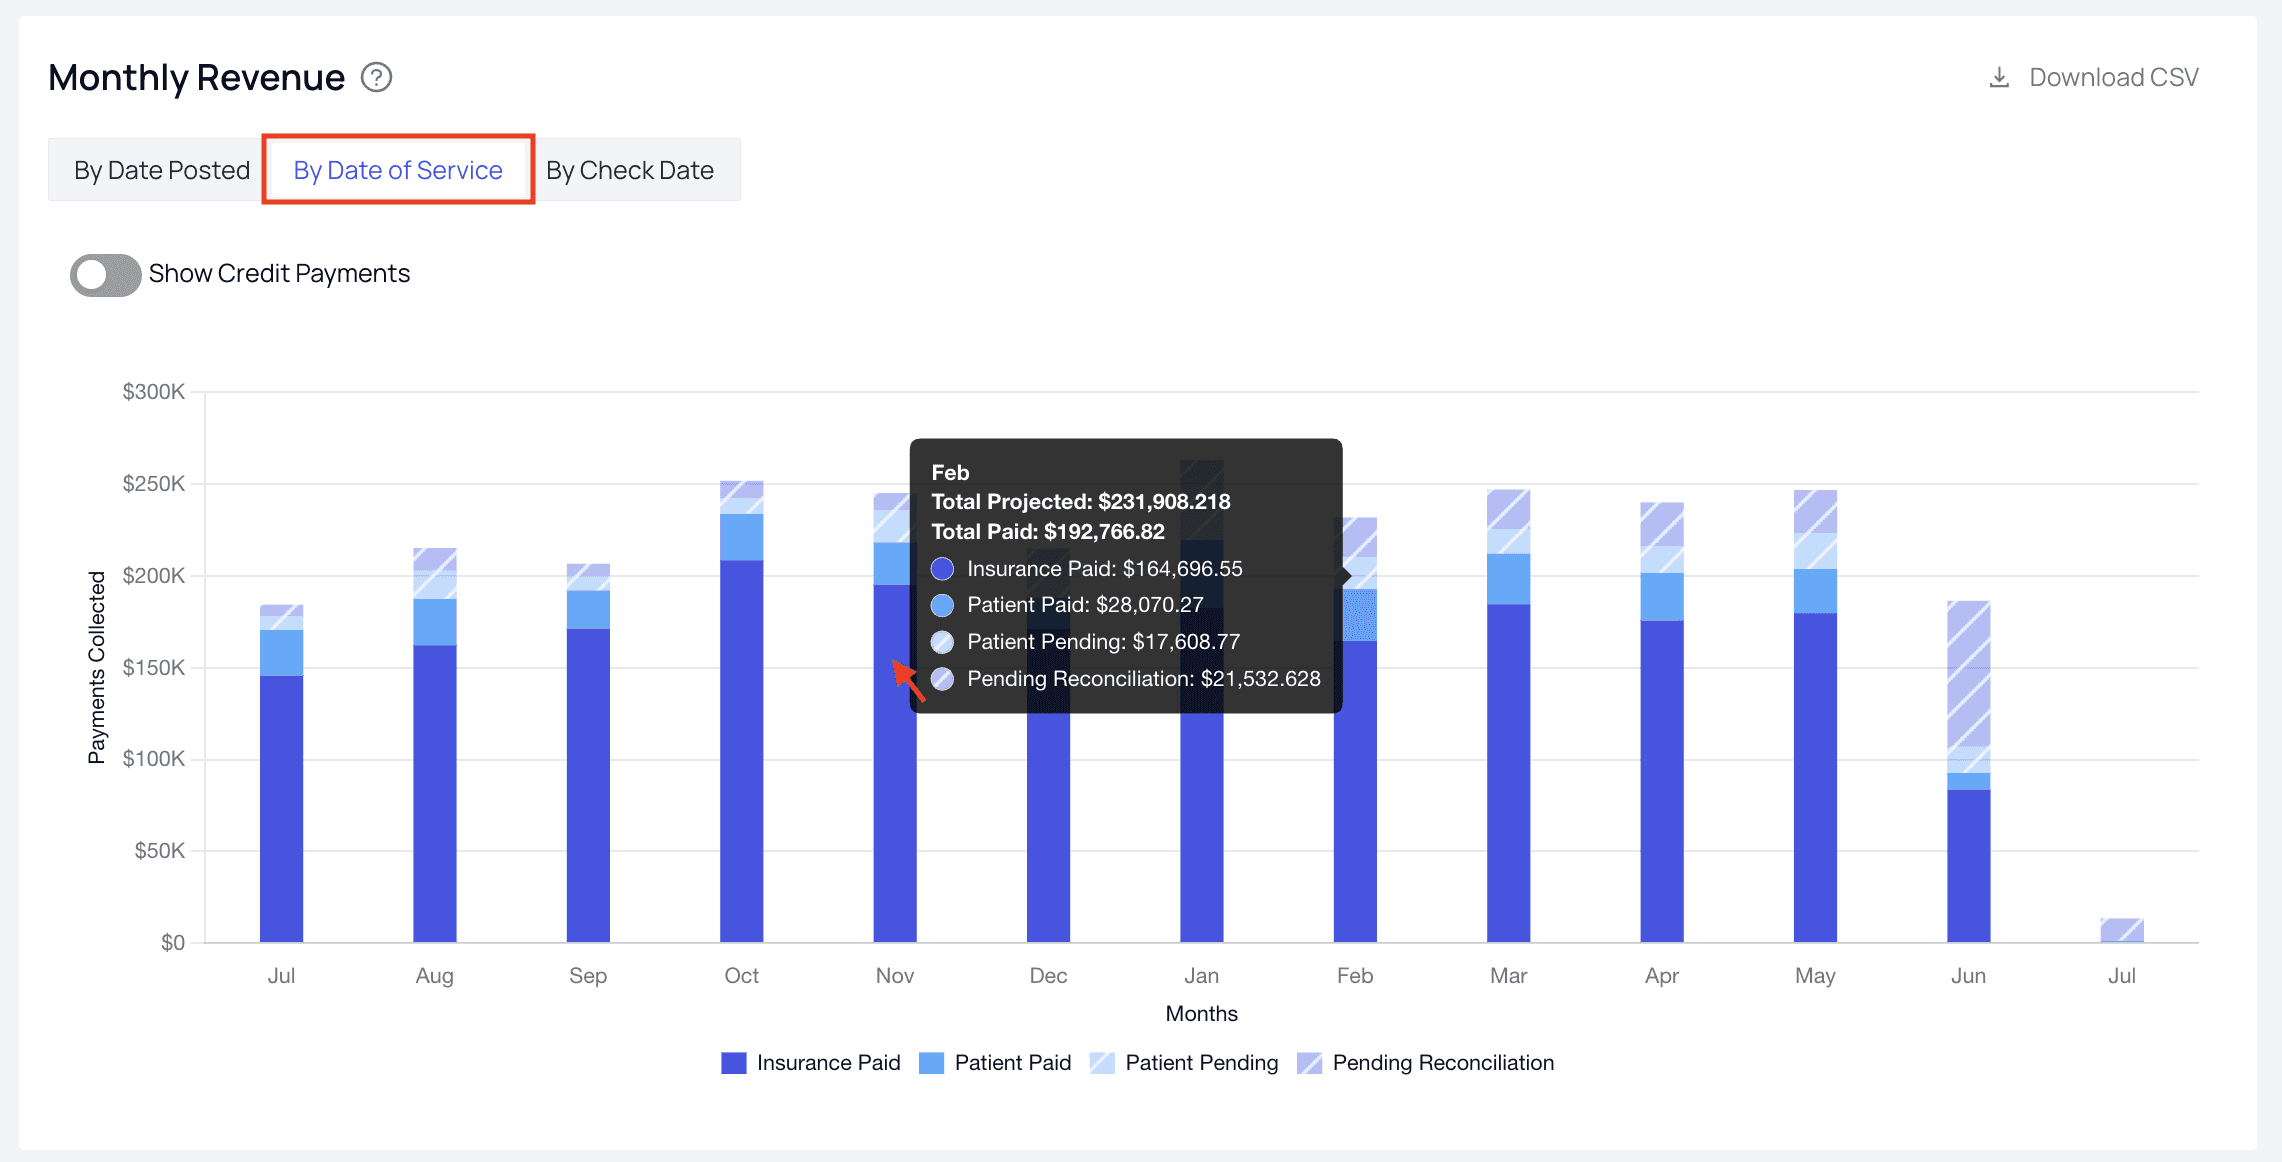
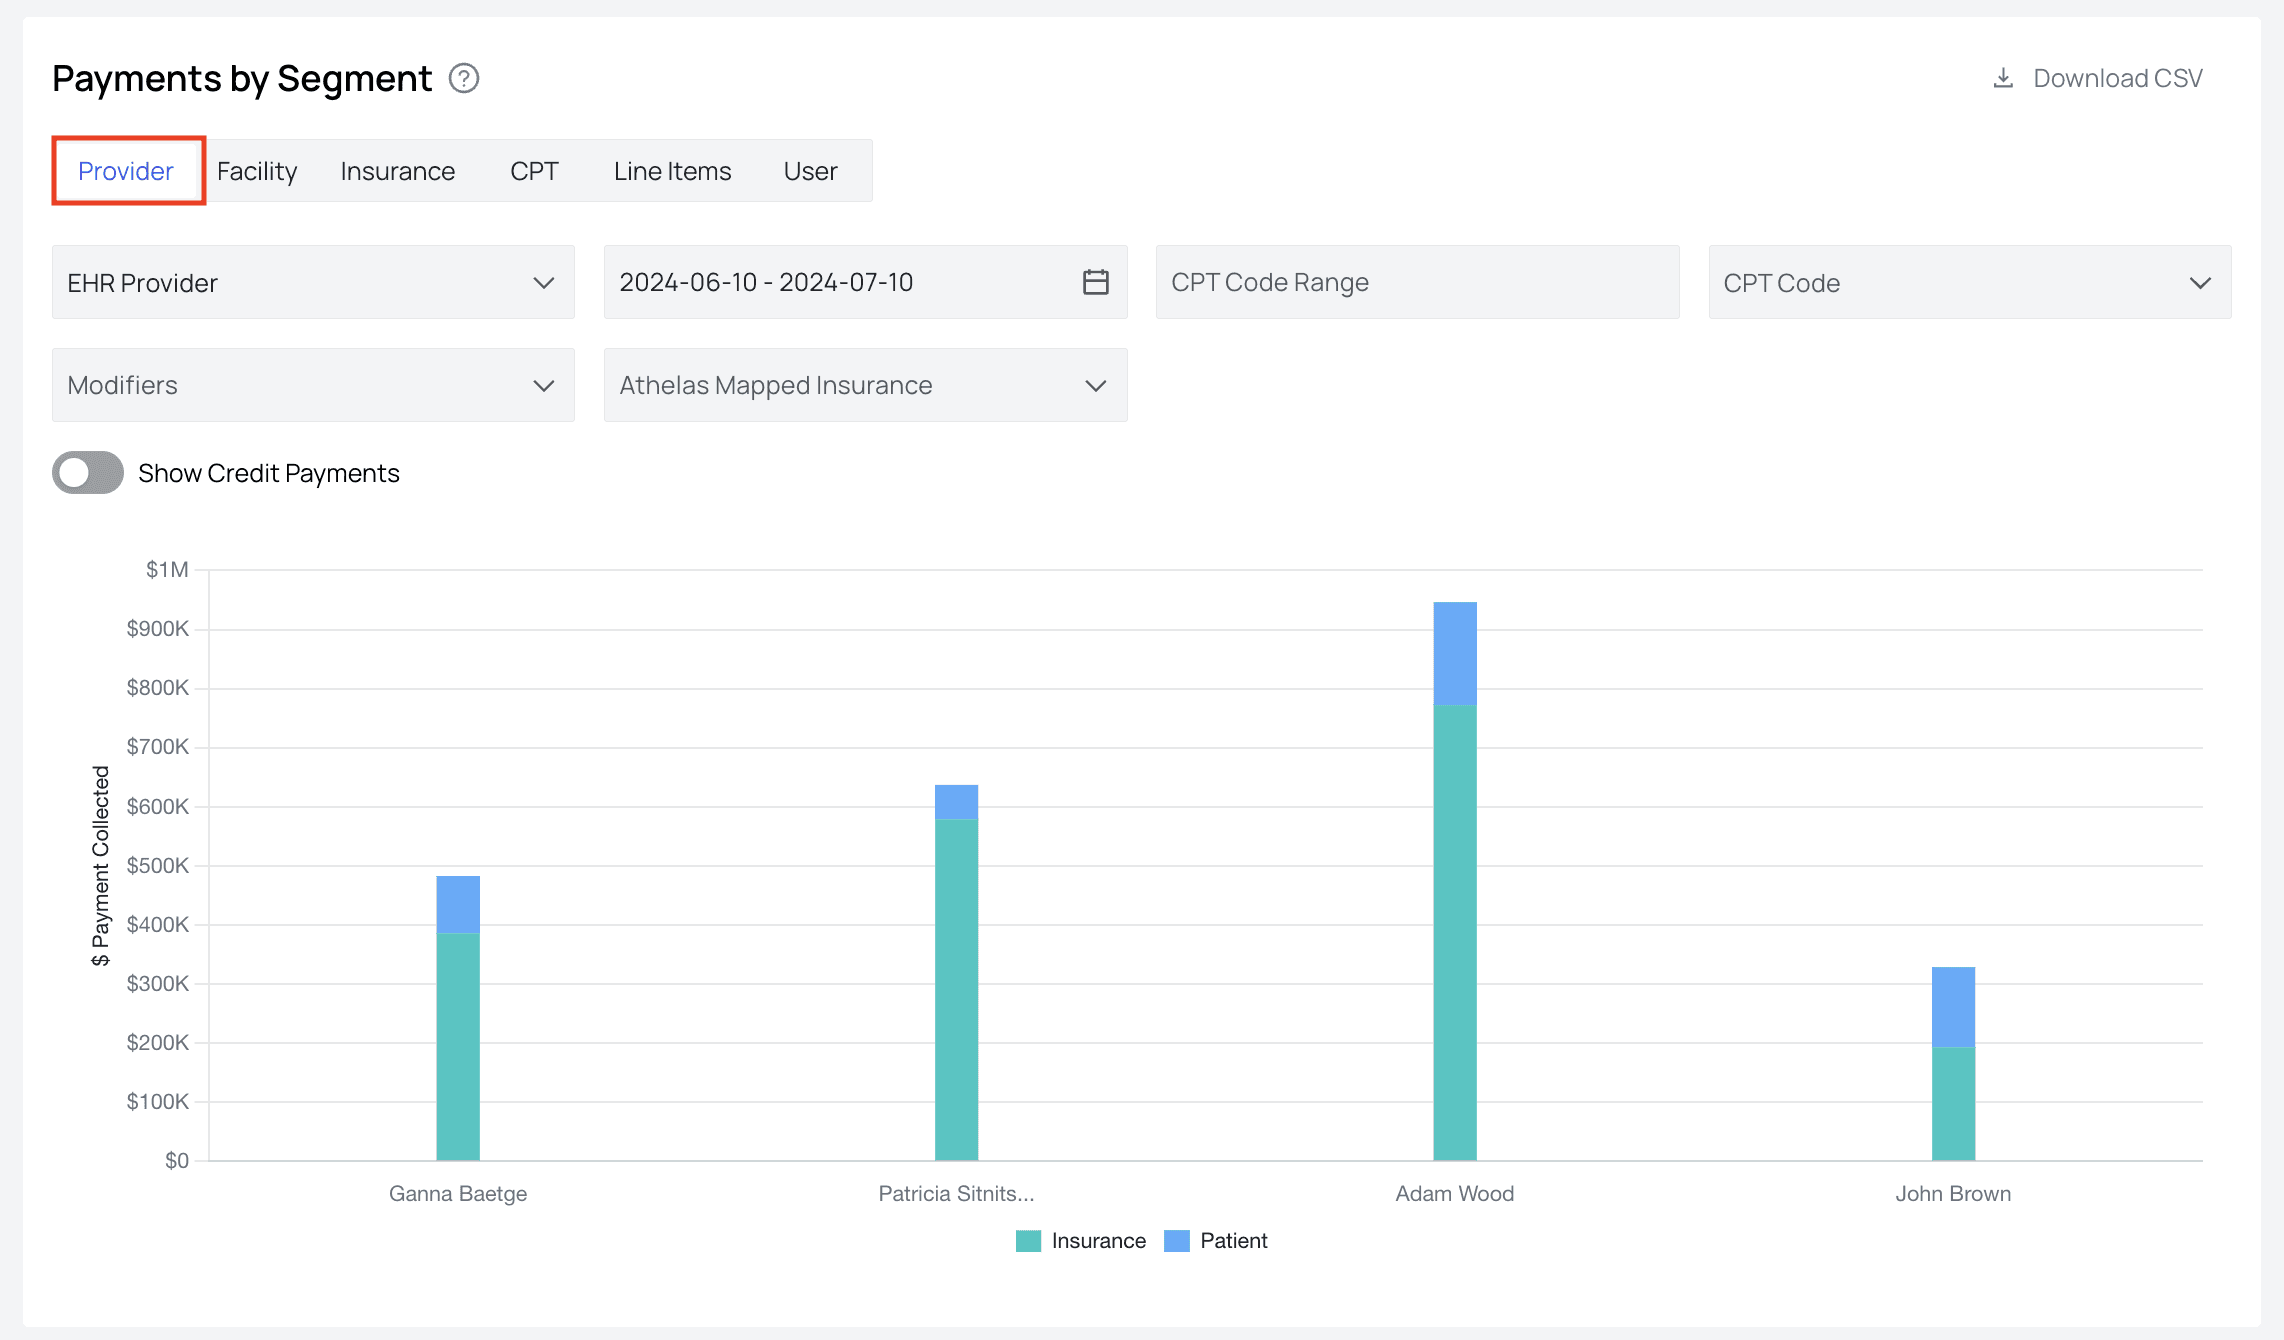
Payments by Segment
Patient Responsibility
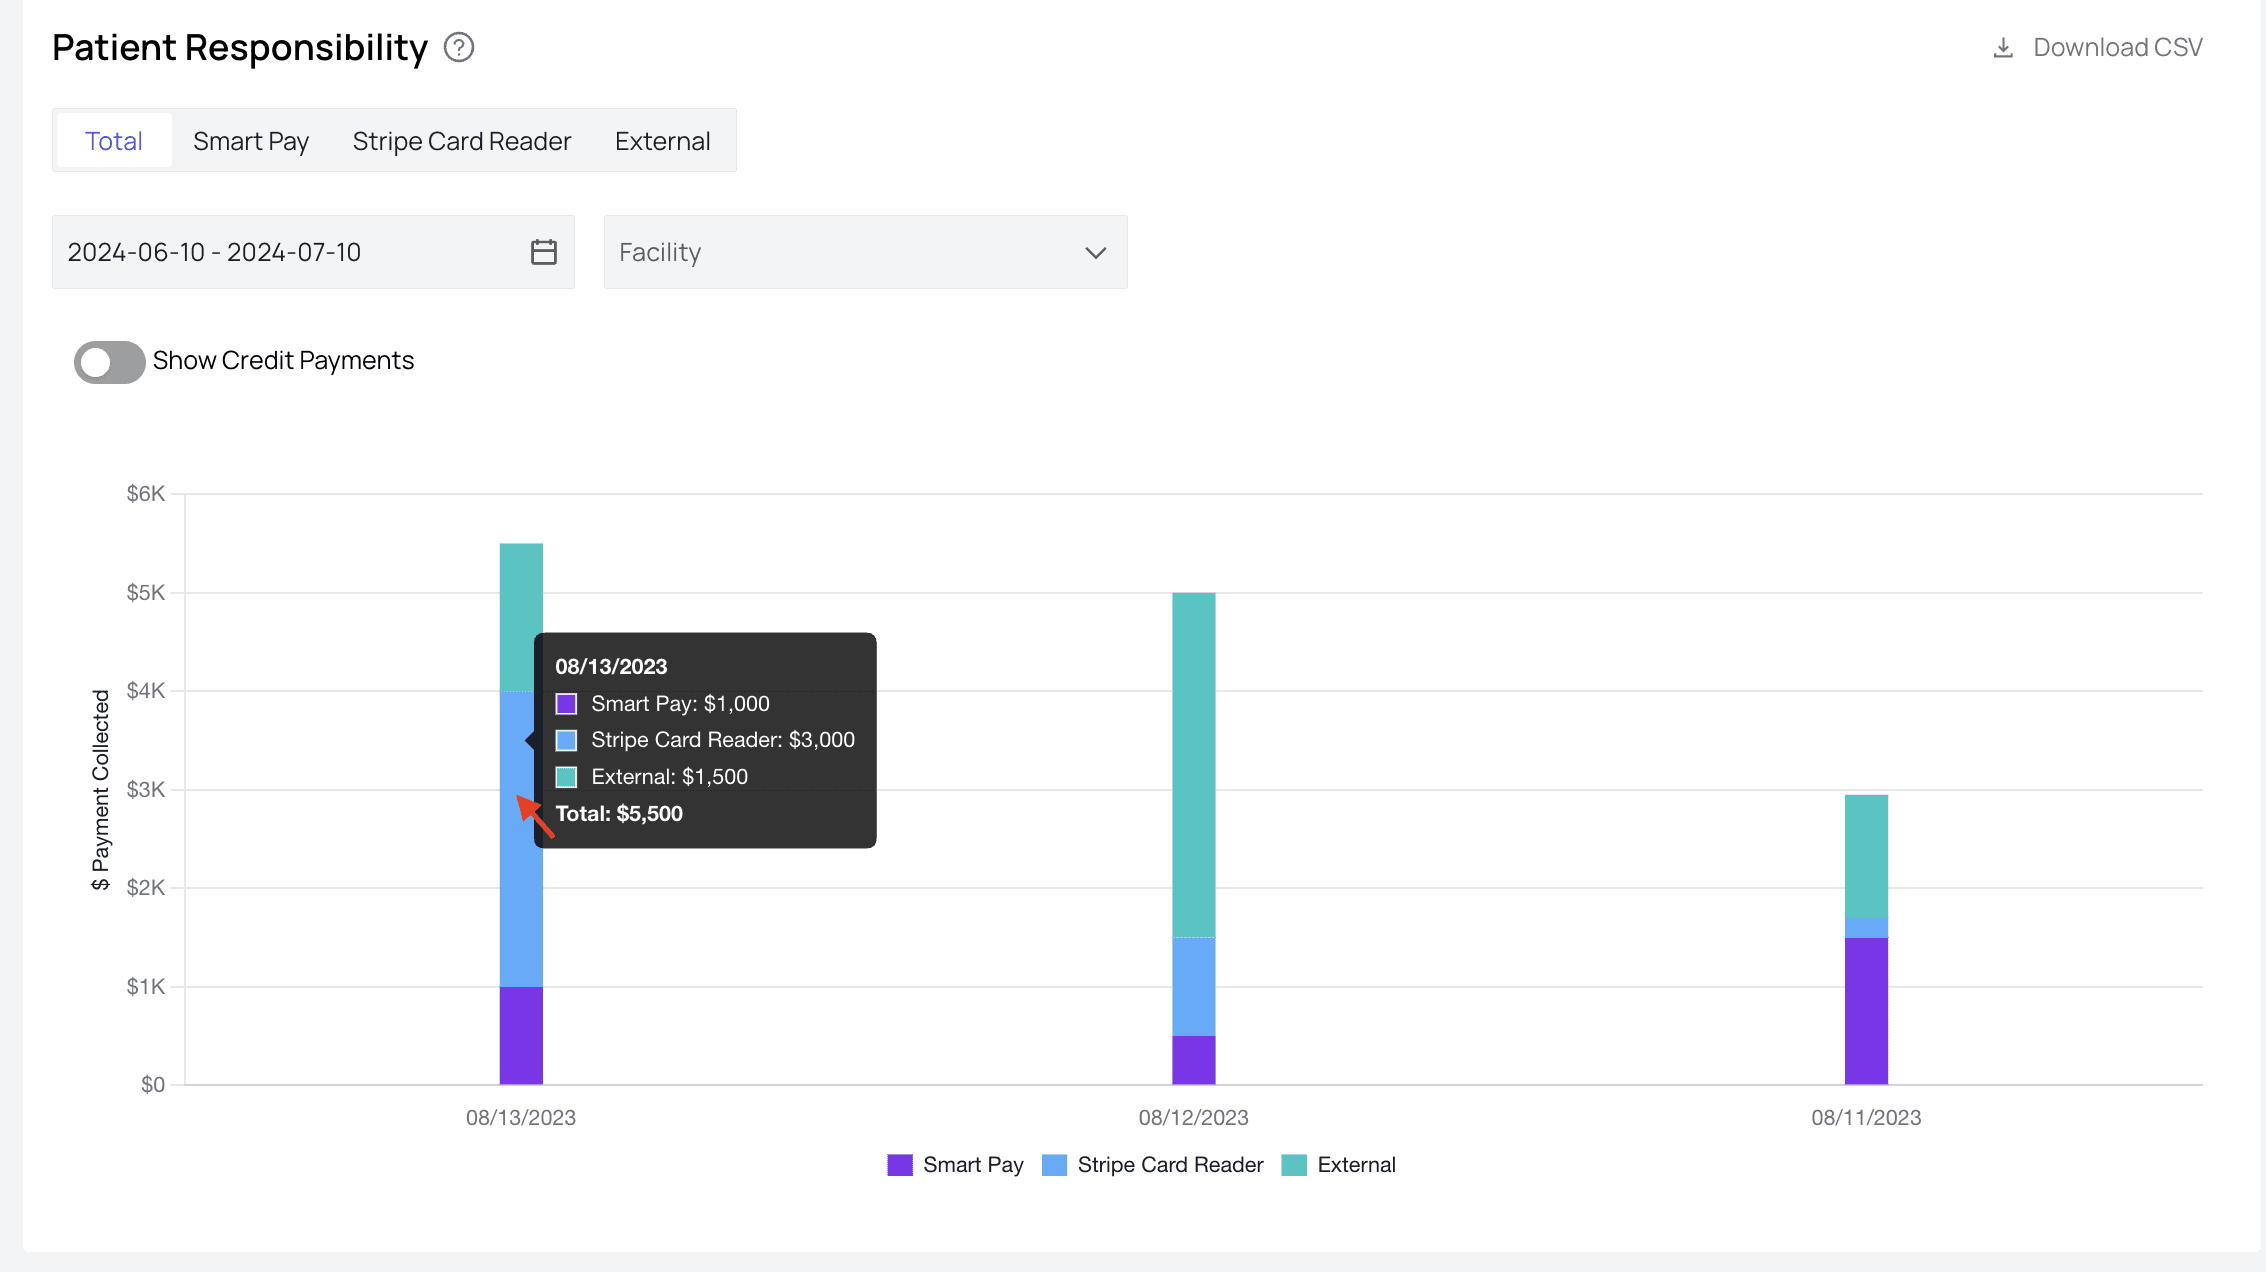
- SmartPay — Payments made through patient payment portals, those made through saved cards, and those made via digital reminders are all considered SmartPay.
- Athelas card reader — Payments collected through your Athelas card reader.
- External — Any cash, check, or other kinds of payments will be recorded here. Keep an eye on any unexpected dips in PR collection. This can signal a need for some greater effort to collect outstanding PR.
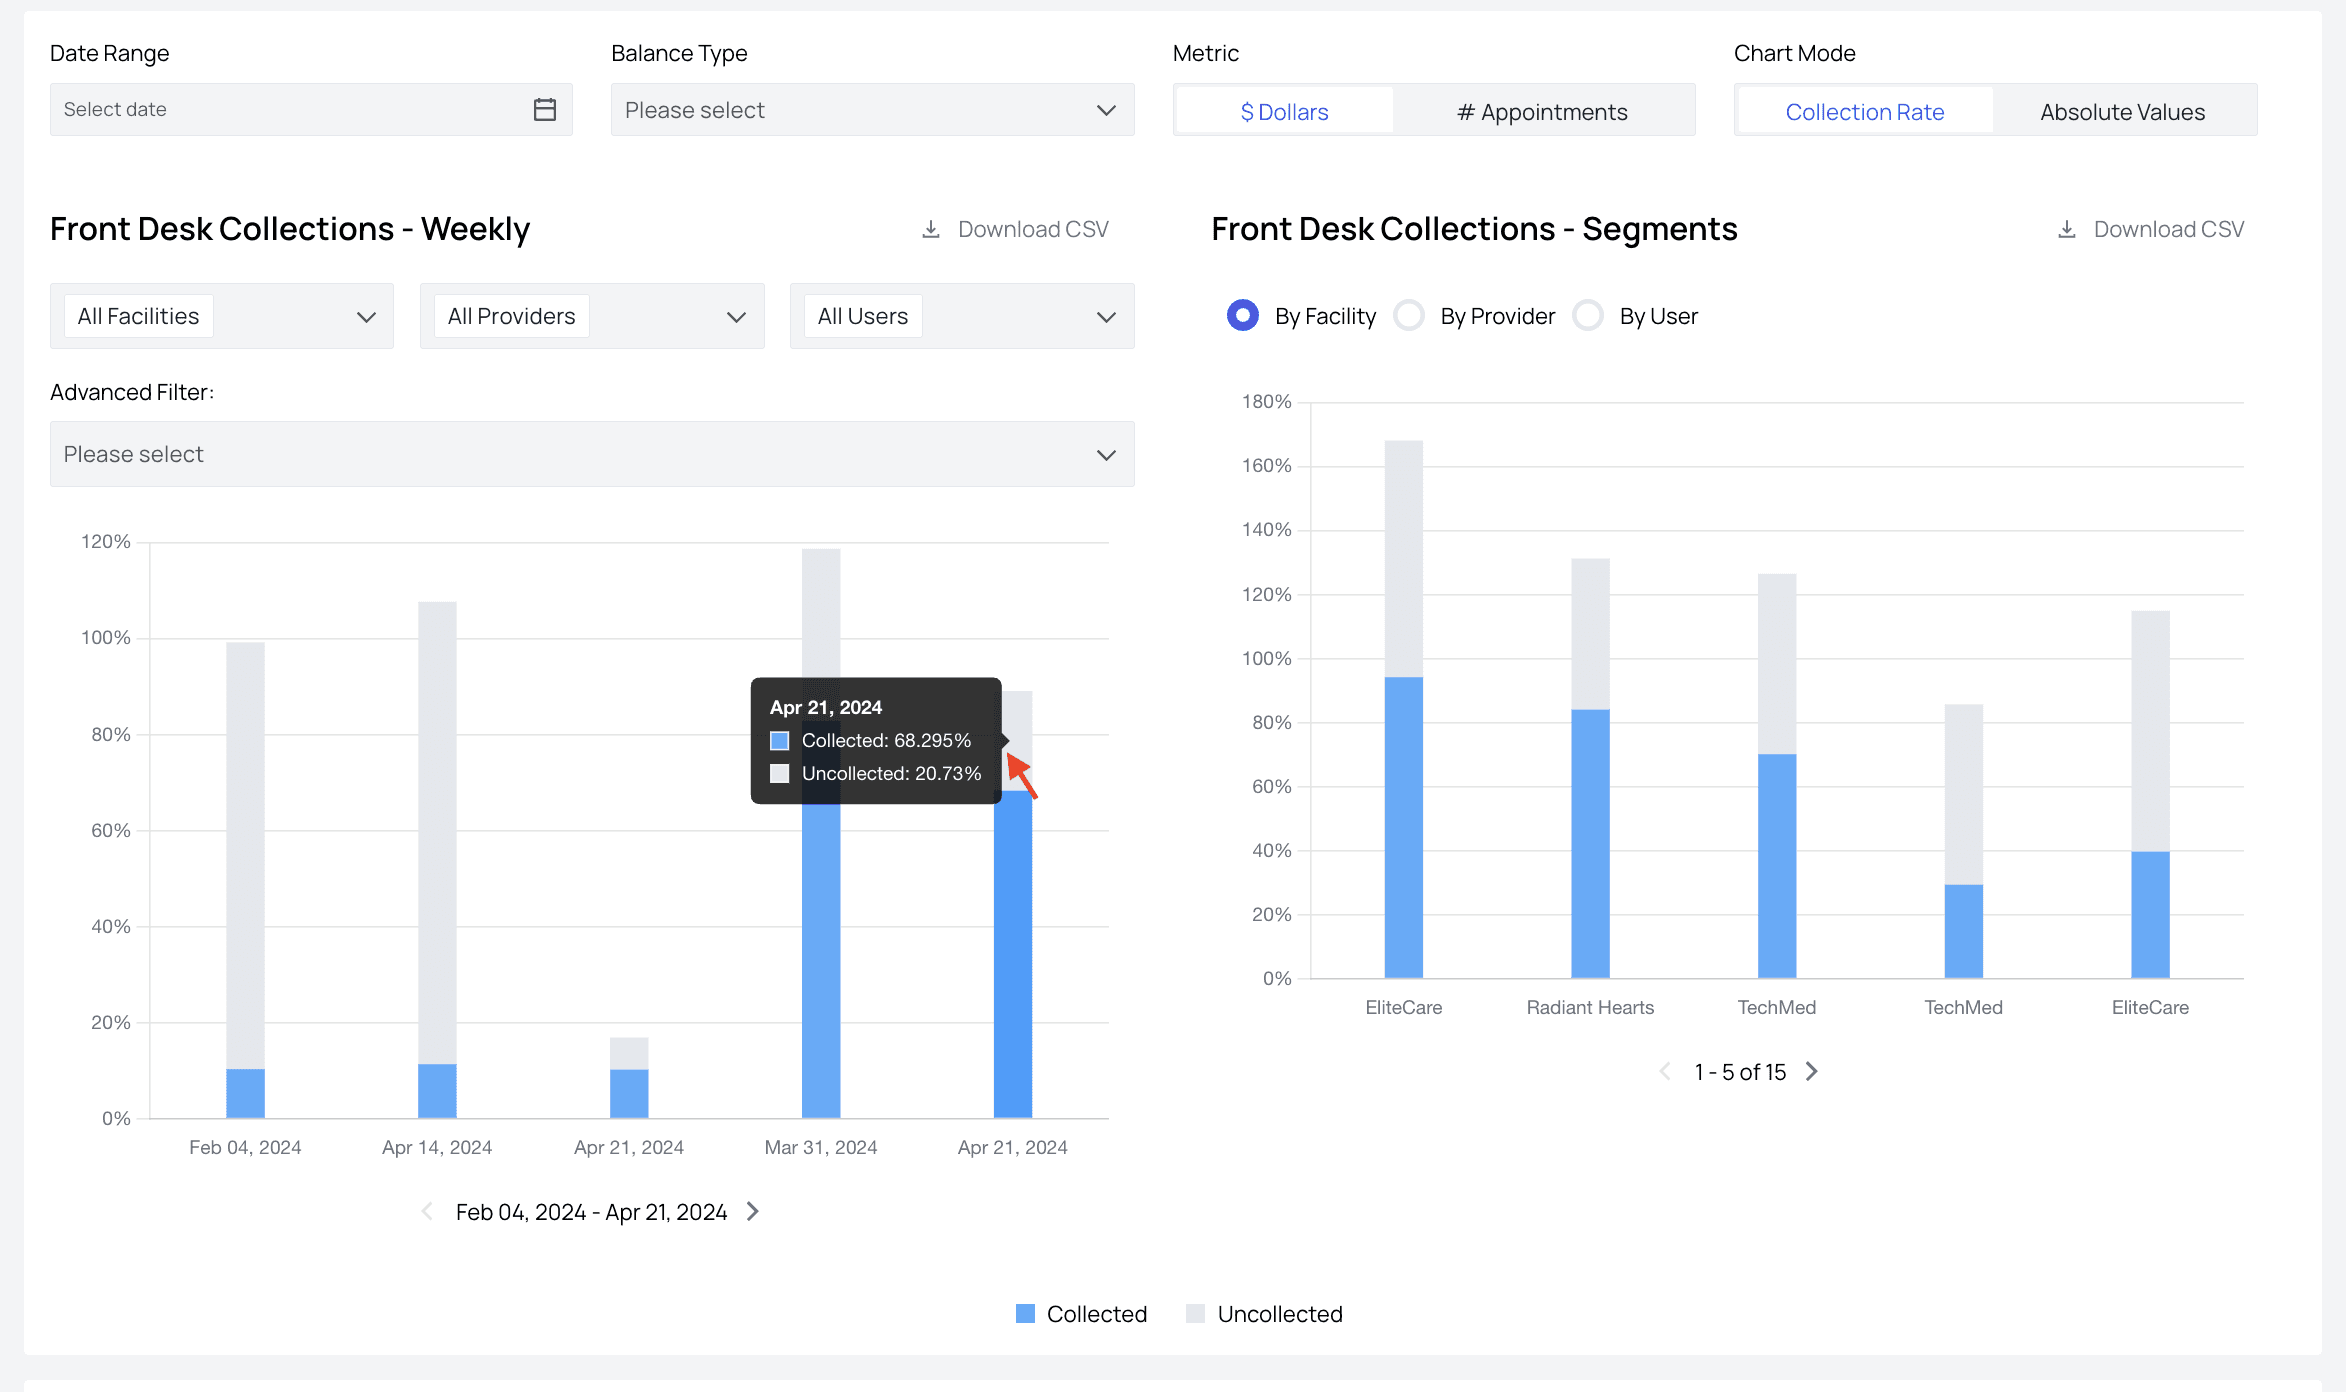
Front Desk Collections
Claims Waterfall
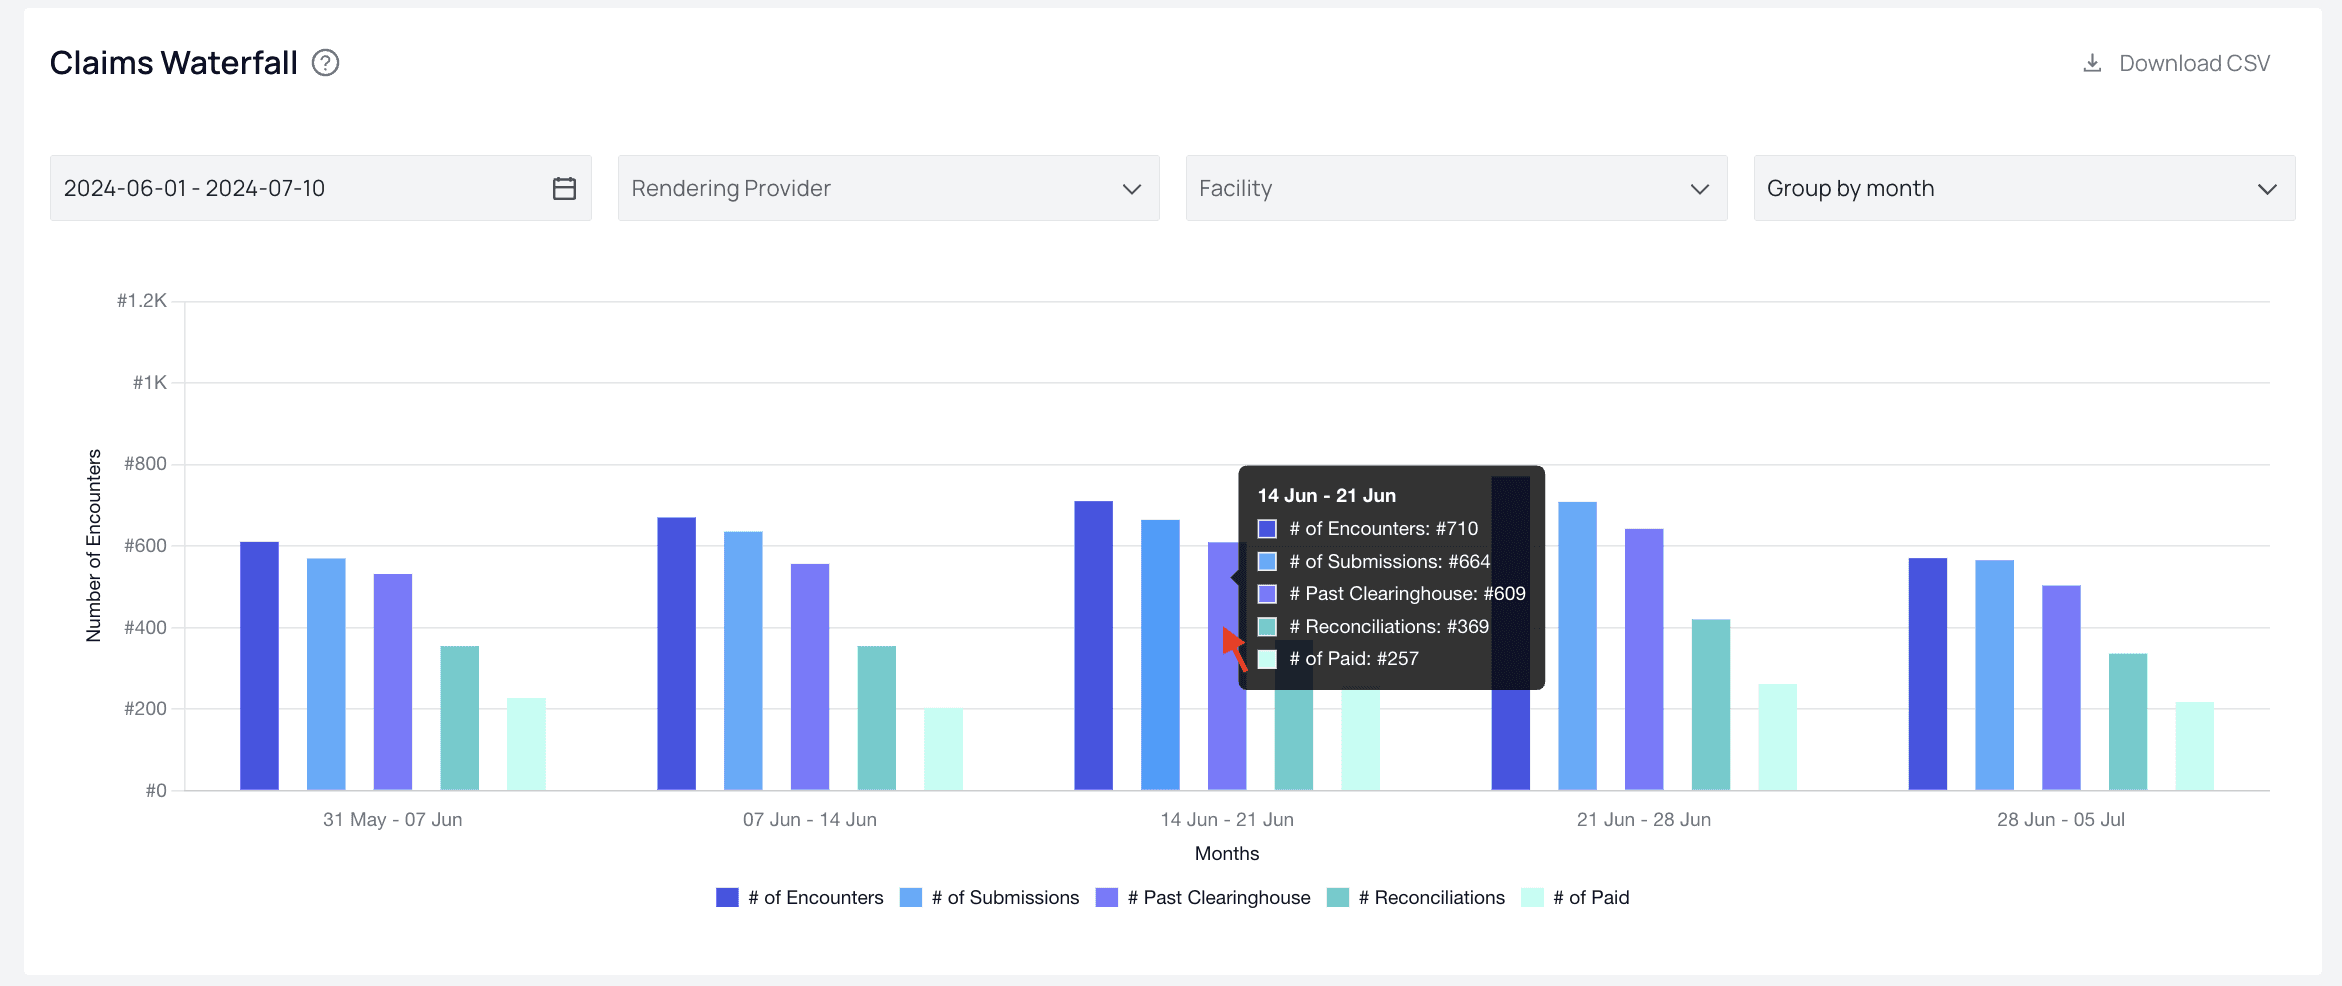
- The total number of encounters (# Encounters)
- How many resulted in a claim submission (# With A Submission)
- How many were reconciled (# With A Reconciliation)
- How many received a payer decision (# With A Decision), and finally
- How many resulted in an insurance payout (# With An Insurance Payout) Using this graph can show you which stage of the process results in the greatest claims drop-off, empowering you to zero in on root issues more quickly.
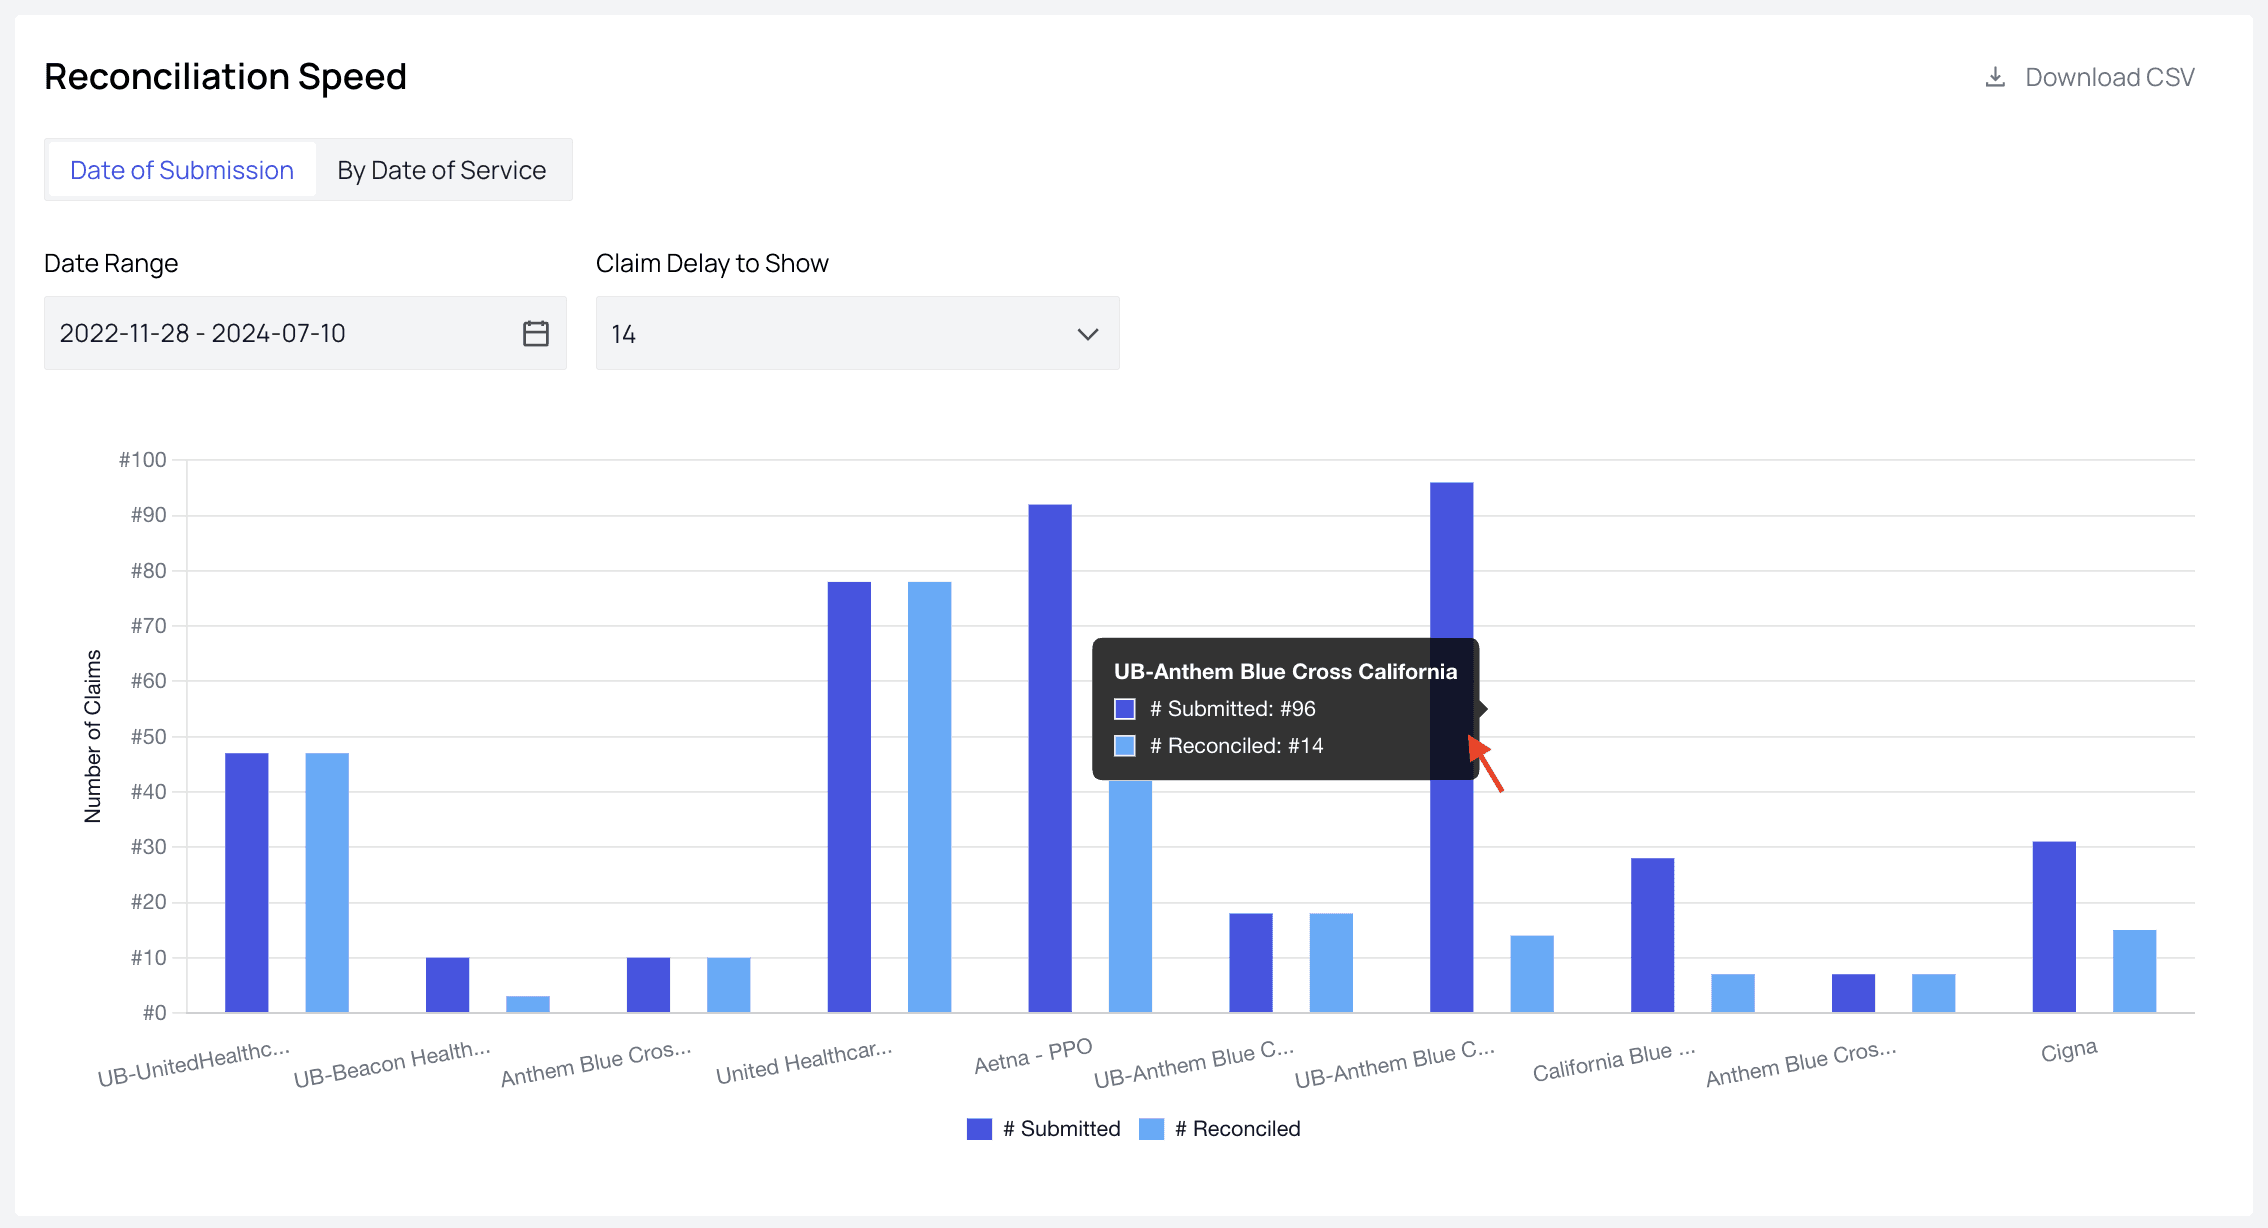
Reconciliation Speed
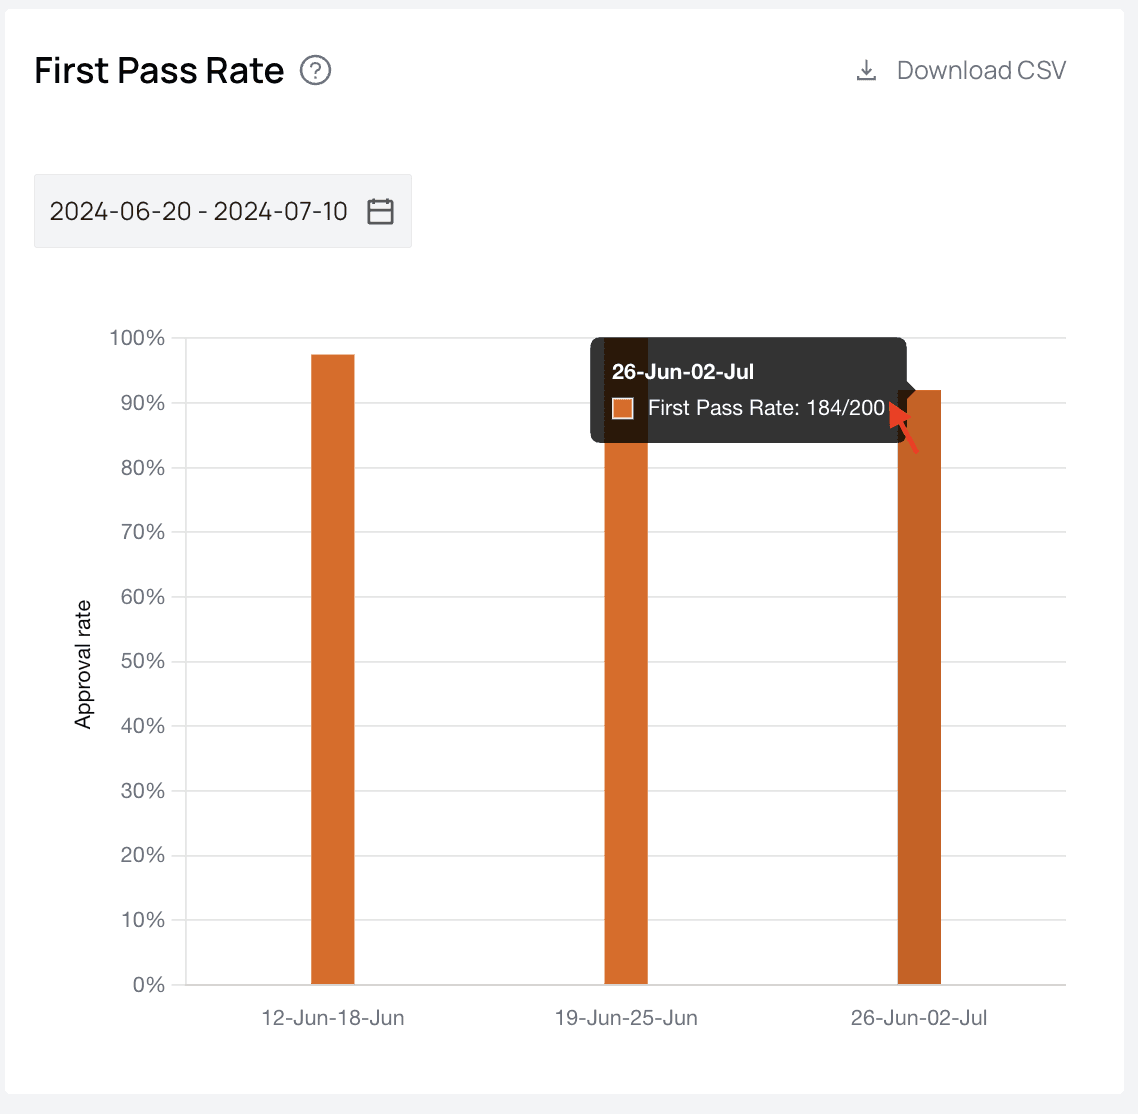
First Pass Rate
Insurance Paid Rate