At a Glance
The goal of the Denials Analysis page is to give your practice clear, accurate, and prompt visibility into denials metrics. With this information, you can track how your practice and Athelas are working together to minimize denials over time, as well as the amount of revenue recovered through successful claim resubmission.Information Available in Denials Analysis
Overview
In the top left corner of the page, you will find a calendar filter that you can adjust to only see denials from a specific time frame. Below that, the page features overall metrics of Denials Resubmitted, Resubmitted Payments Recovered, and the Finalized Denial Rate. The industry standard denial rate is 11%, so anything below that means you are recovering more money from denials than the average. The Denials Analysis page focuses on trend visibility over time.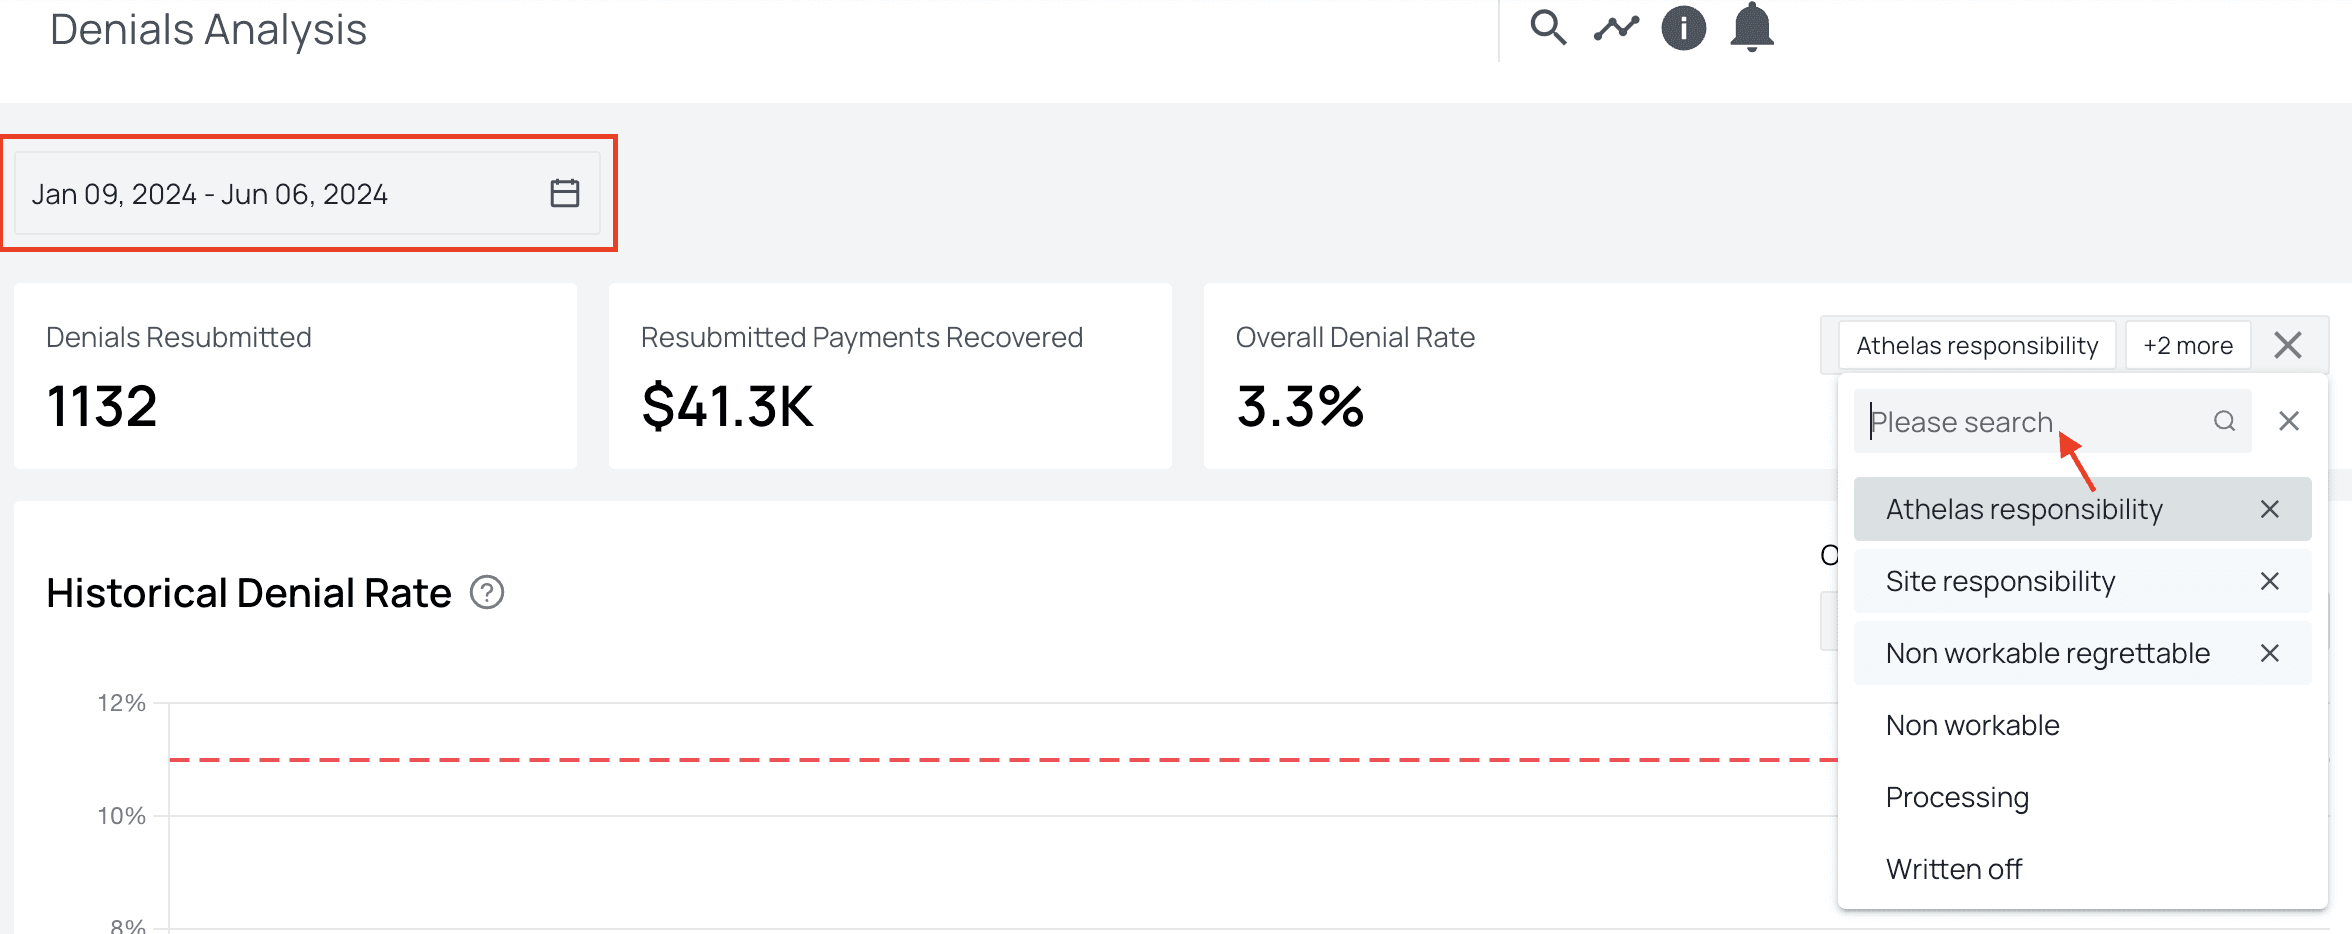
Finalized Denial Rate
On this bar graph, you can see your practice’s monthly denial rate—the percentage of all encounters at the Finalized or Patient stage that were denied. Hover your cursor over one of the bars to see that month’s exact denial rate. The dotted red line marks the aforementioned 11% industry standard denial rate.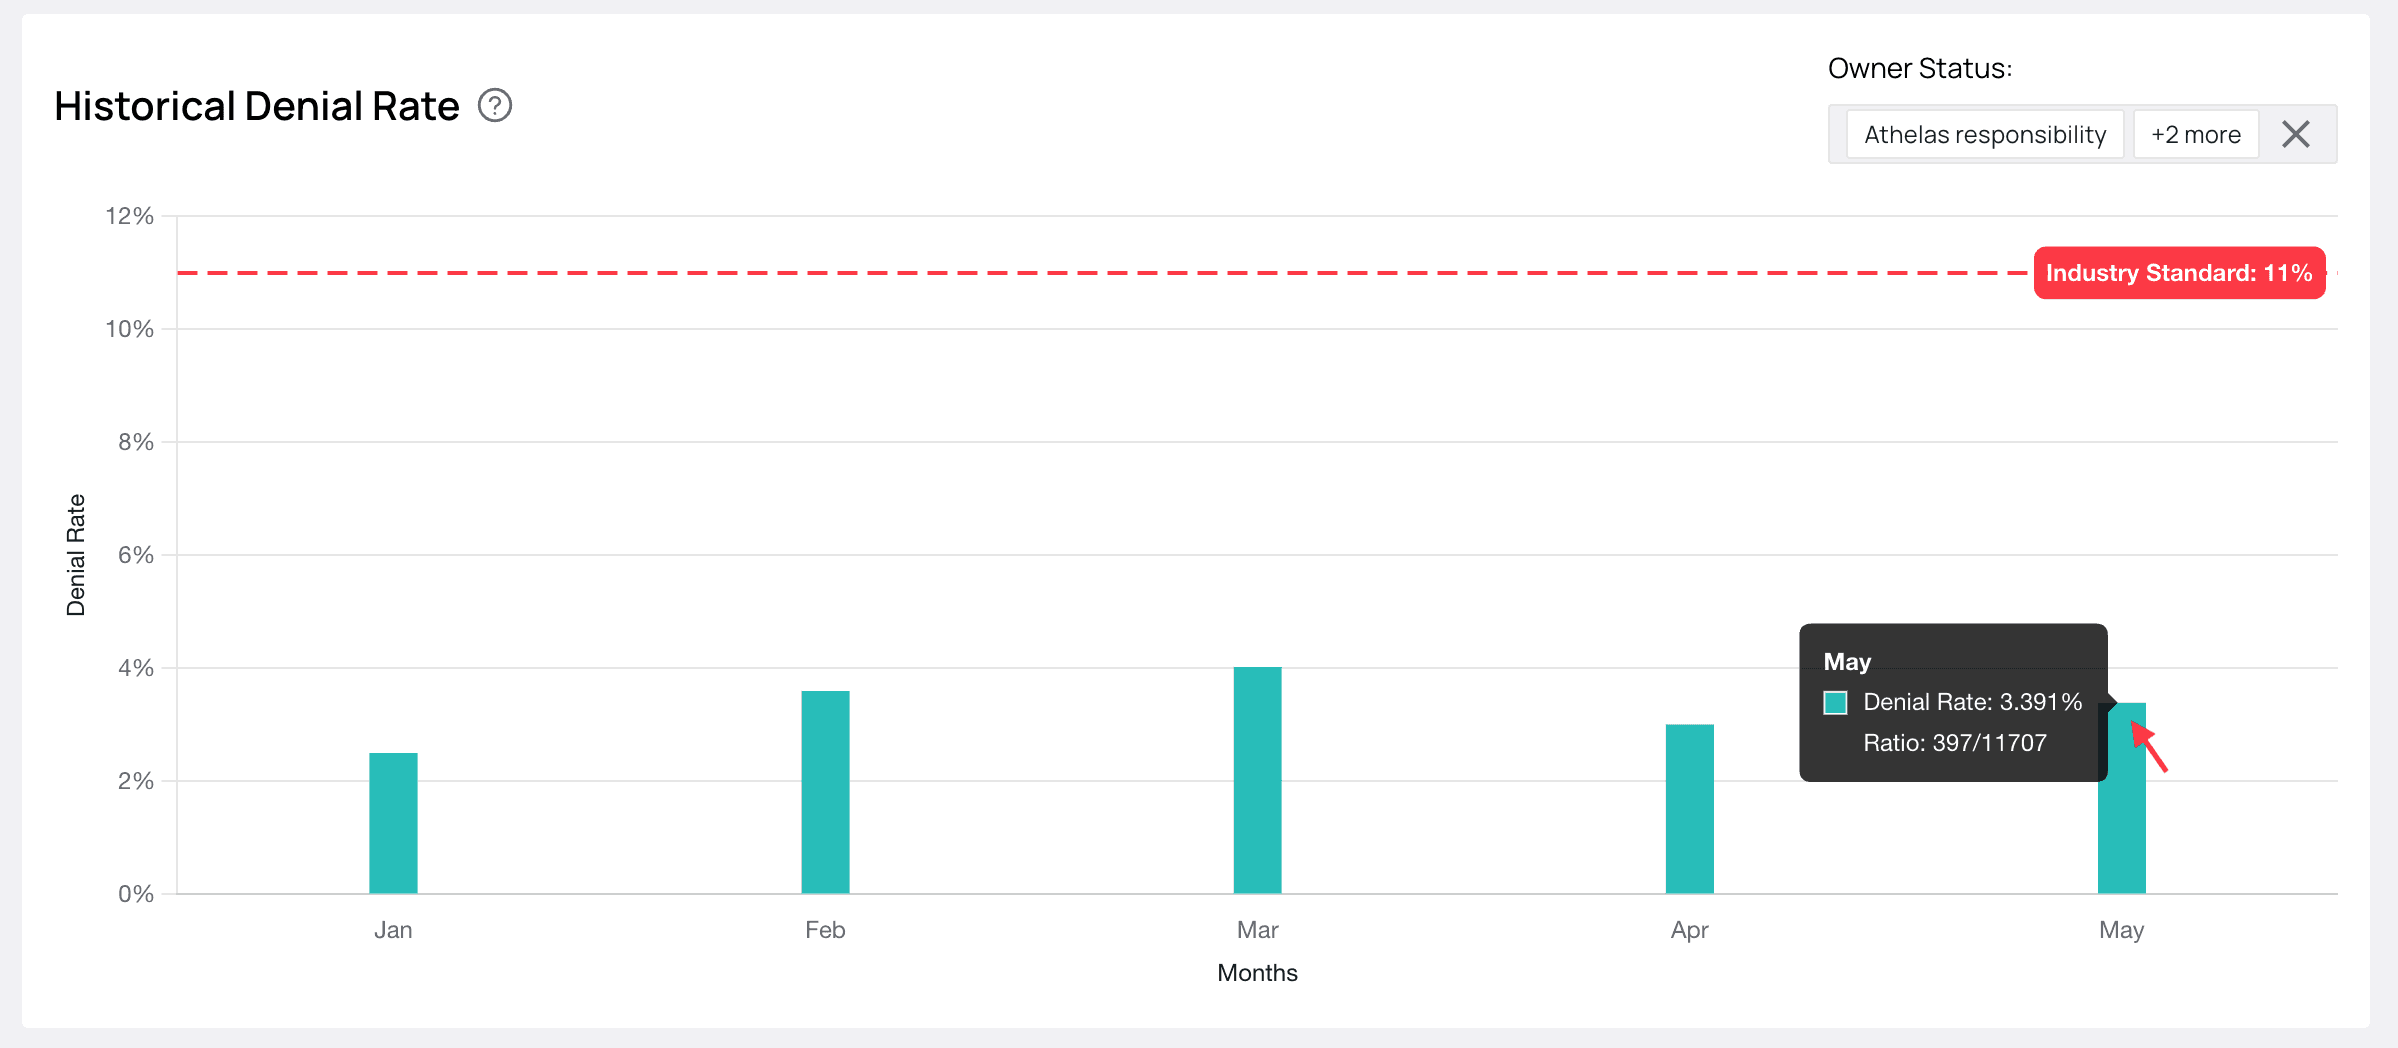
Resubmitted Payments Recovered
This bar graph shows exactly how much money you have recovered from denials with Athelas—the insurance payments collected by resubmitting and appealing claims that were previously denied, totaled over time. Hover your cursor over a bar for details.
Denials Resubmitted
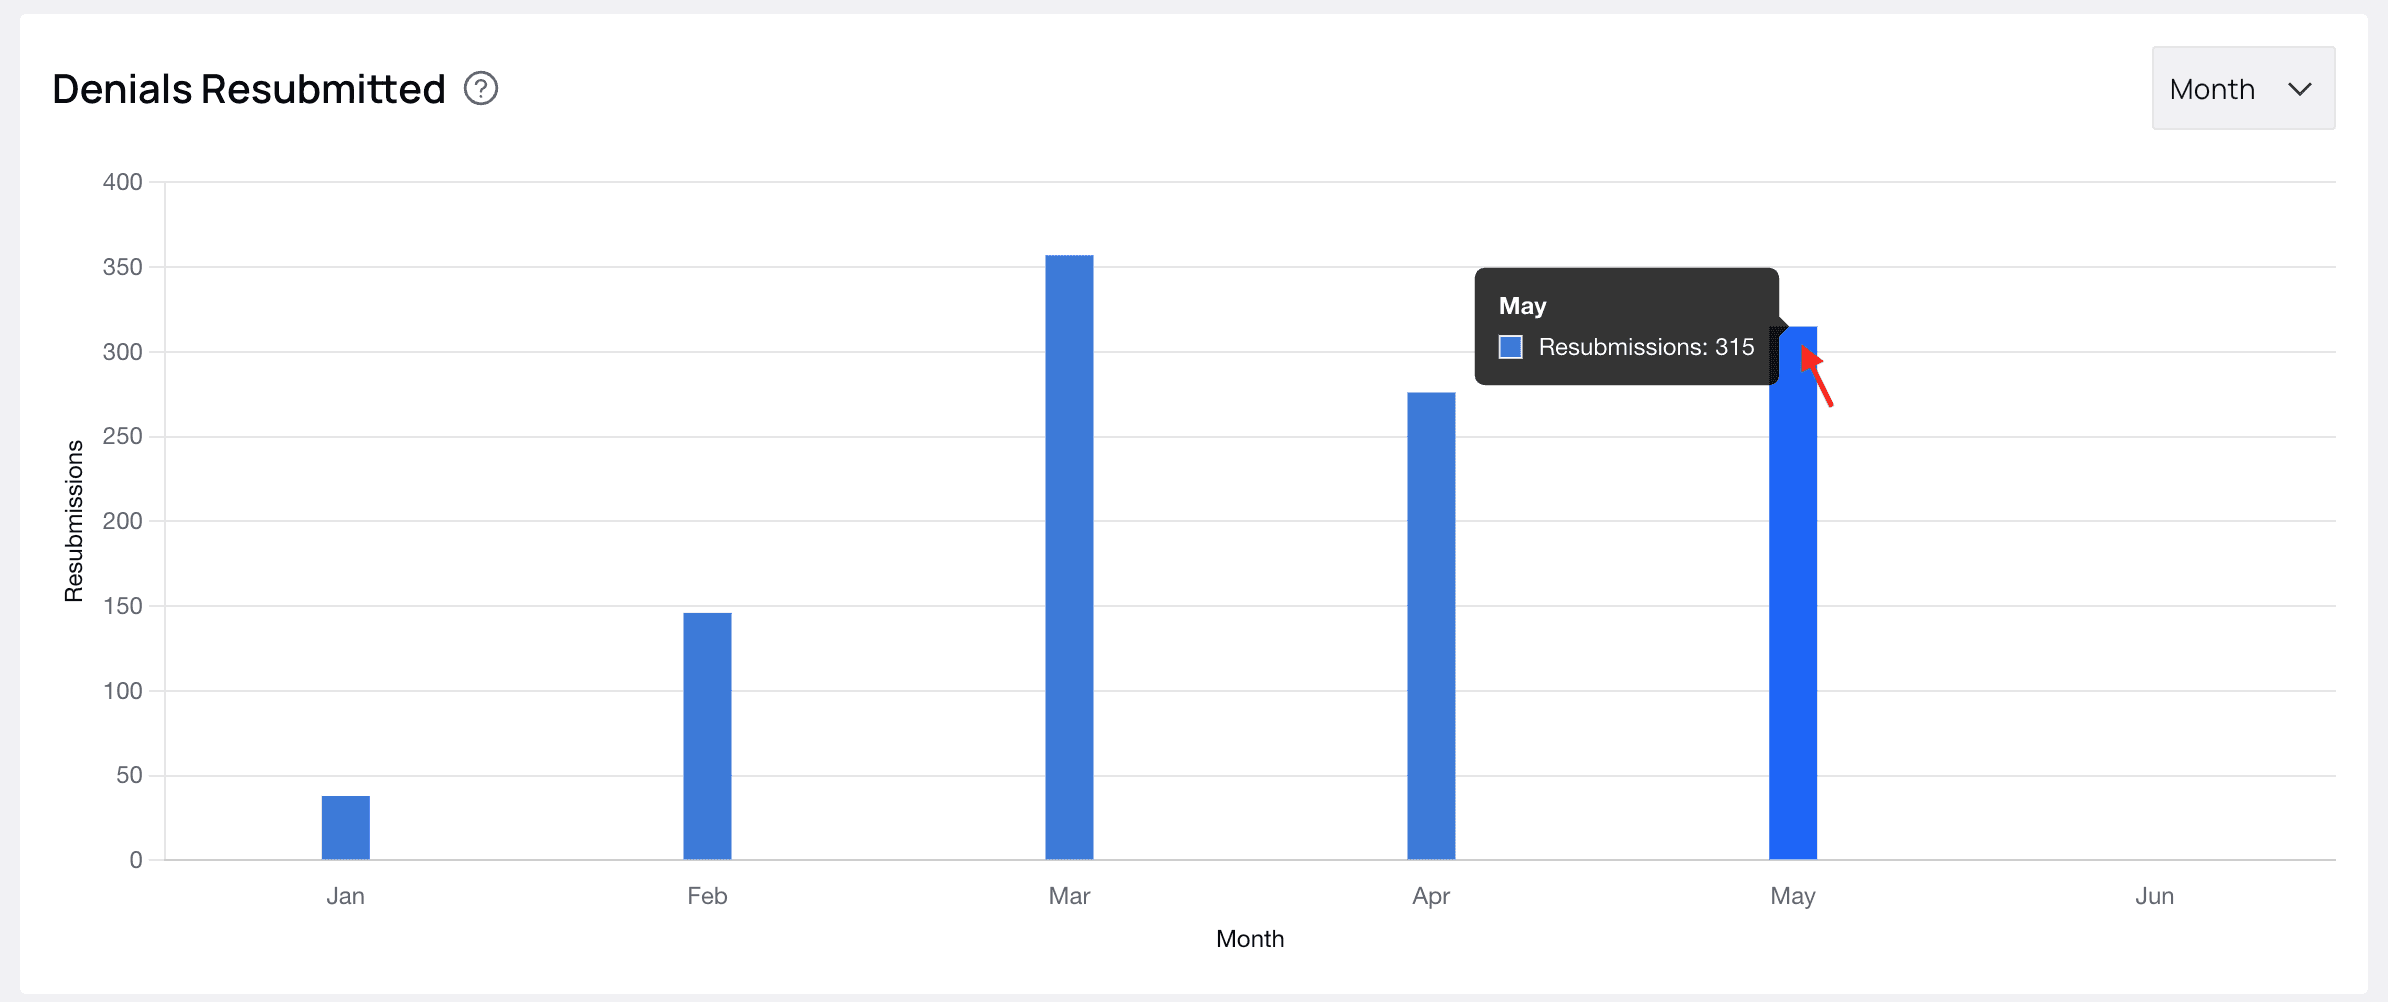
This graph shows how many denials have been edited and resubmitted. This will give your practice a better picture of the work Athelas is doing behind the scenes that may not otherwise be apparent. In the top right corner, use the period selector to switch between Month and Week results.