Session Analytics
The Session Analytics window allows you to view important metrics at a glance. It provides general information and context so that you can prioritize and focus attention on any potential issues. Filter for the time period to view at the top, and the four boxes will calculate and display:- Total sessions
- Success rate
- Appointments scheduled
- Estimated dollars saved Click through the carousel and hover your cursor over each graph to see further details about:
- Sessions over time
- Inbound, outbound, and total number
- Session status breakdown
- How many calls are completed, in progress, or need action
- Event types over time
- How many calls were made to create appointments, add patients, etc.
- Sentiment distribution
- Positive, neutral, or negative
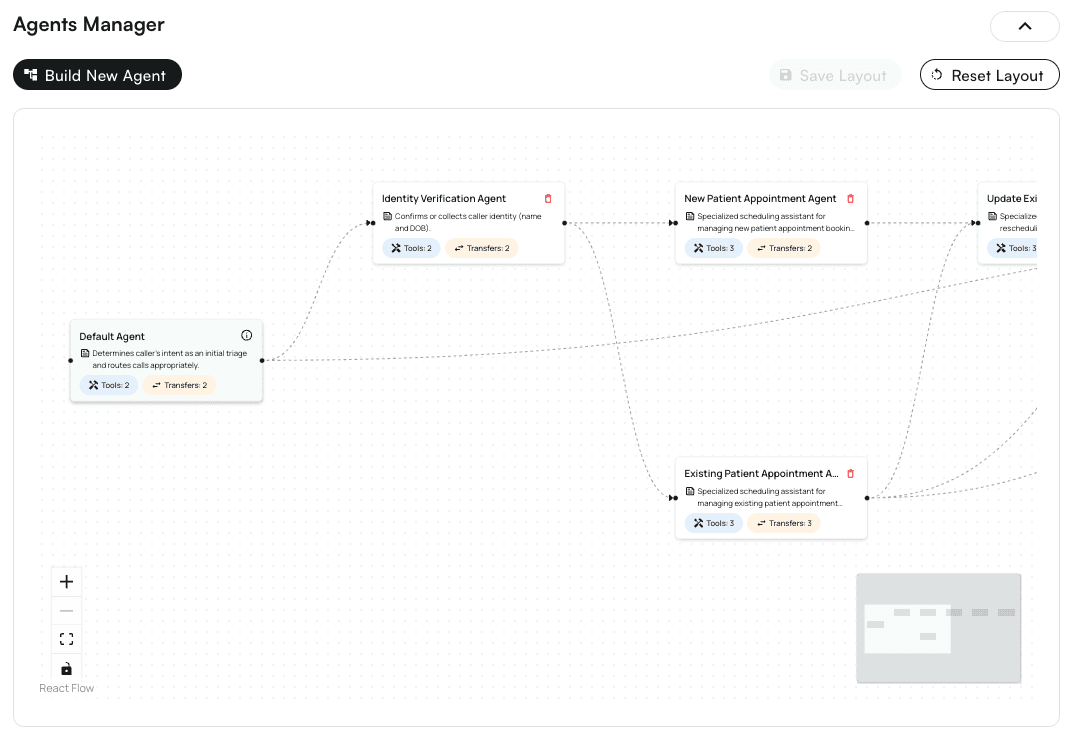
Agents Manager
With the Agents Manager, you can:- View all agents
- Configure new outbound agents for specific tasks
- Connect new agents into the existing network for reusability
- Customize agent behavior and scripts The Agents Manager allows you to track the flow of conversations with callers through each agent, beginning with the Default Agent in the green box on the left.
- Patient pre-visit screens
- Post-visit follow-ups and check-ins
- Patient outreach for new campaigns
- Sending one-off calls to patients on a waitlist
History
The History section of the Agents Center stores information about all current and past calls made through the system. Use the filter at the top of this section to expedite your search for a specific patient, session type, created date range, etc.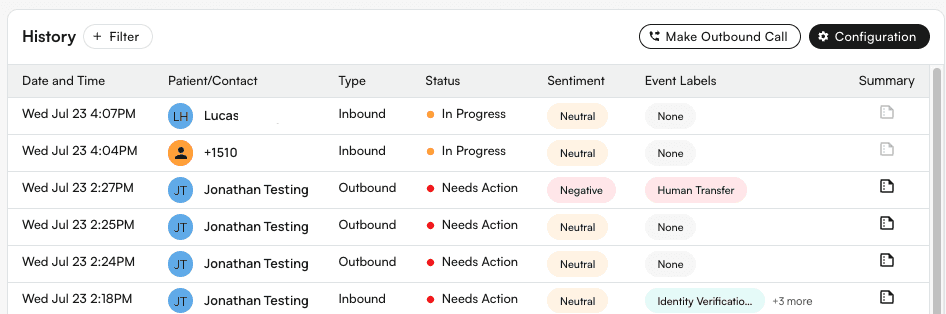
View what happened during the call
Select any row to see full details about that call, including the recording, summary, transcript, and sequence of events that transpired. If actions were taken, like an insurance update or appointment creation, as shown in the example below, you can click a link directly to the corresponding page.