
What you can do
- Track performance across patient acquisition, retention, outcomes, productivity, billing quality, and operational efficiency.
- Drill down from a high-level summary into facility, provider, patient, case, referral, lead, appointment, chart note, and encounter-level records to investigate a specific number.
- Filter and group by provider, facility, time period, credential, measure, referral source, payer, and other available dimensions.
- Save frequently used report configurations for quick access.
- Export any report or drill-down as a CSV for offline analysis, patient follow-up, or executive review.
The three report engines
Most reporting is organized into three engines. Each engine focuses on a different operational objective and carries its own metrics, groupings, filters, and date behavior. You select an engine from the Report Categories dropdown.
The Report Categories dropdown also offers five further categories alongside the engines: Executive Org Overview, Clinic Provider, Referral Management, Scheduling Forecasting, and Patient Experiences NPS. They are documented on Report Categories, which also lists every category in one table.
To learn how to configure and run a report, see Building a Report.
Note: The metrics available to you may vary based on your organization’s configuration and enabled features.
Accessing EHR Reports
To open EHR Reports:- Sign in to Insights.
- In the left sidebar, expand the Insights section.
- Click EHR Reports.
Understanding the interface
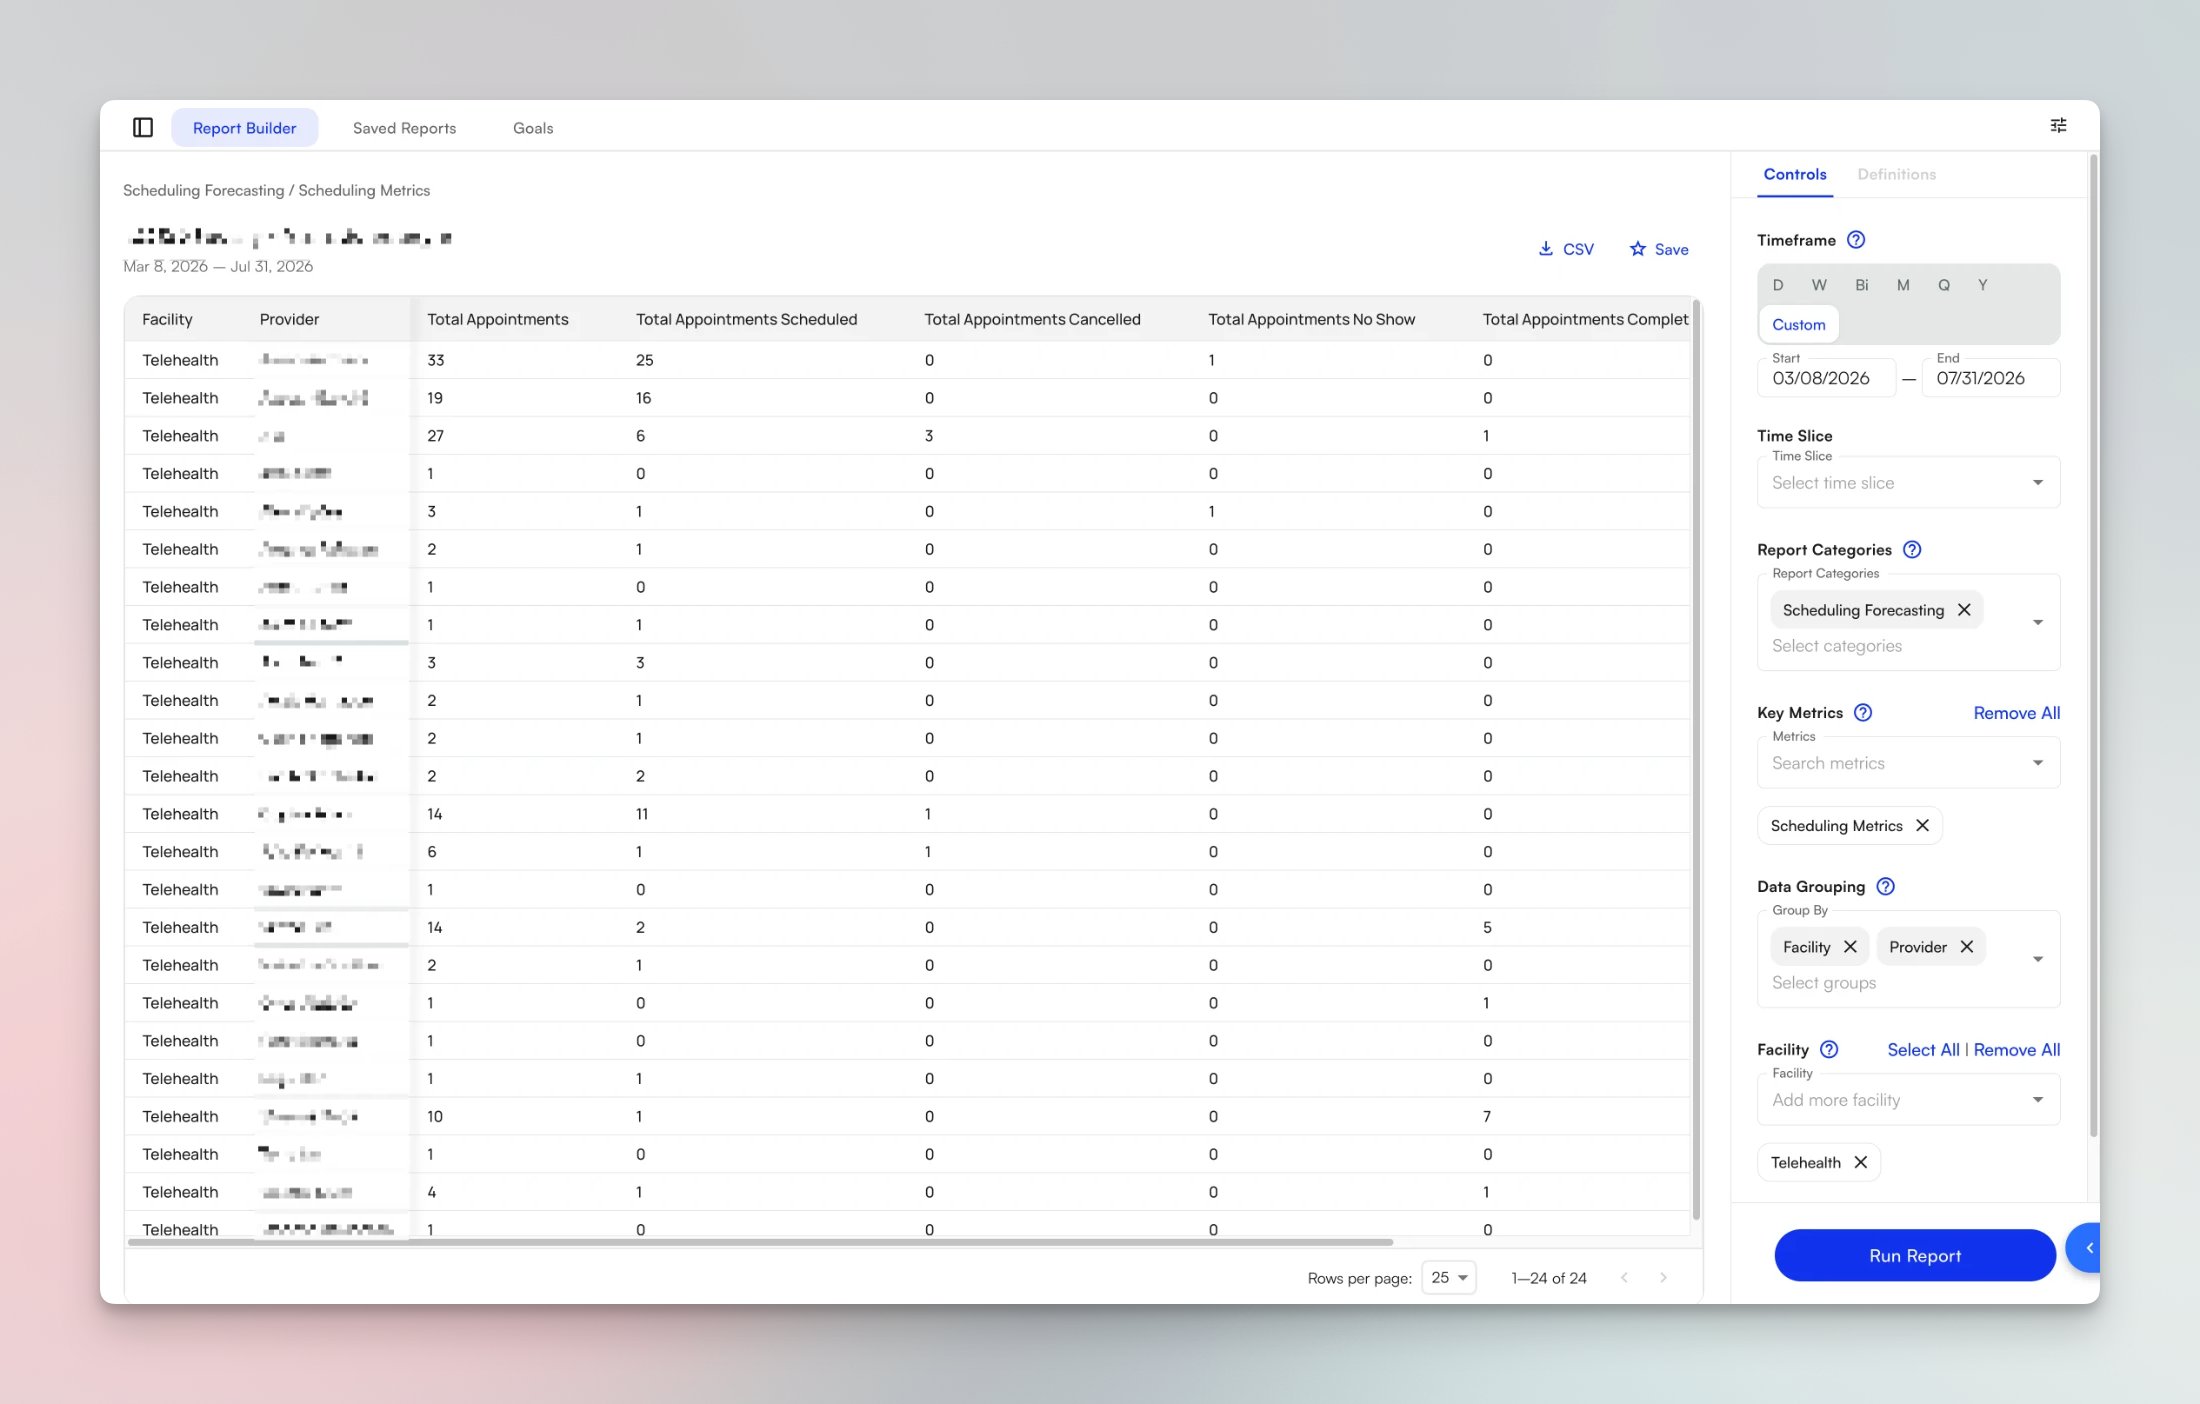
The Report Builder tab is divided into two areas:- The report results area on the left, which is empty until you run a report. Once a report runs, results appear here as a data table with CSV and Save actions in the top-right corner.
- The configuration panel on the right, where you set up your report parameters. The panel has a Controls tab holding the report parameters and a Definitions tab describing your report’s columns. Each control has a ? icon that links to the documentation for that control.
All reports
Every report you can pick in Key Metrics, grouped by the category that contains it. Follow a link for that report’s full column list and definitions. The ? icon next to Key Metrics in the product brings you to this list.Scorecard
High-level patient acquisition and caseload movement. See Growth Engine.Patient Flow
Evaluation timeliness, new-patient arrival outcomes, schedule fill, and lost-patient risk. See Growth Engine.Referral Volume Conversion
The referral pipeline for leads that have a referring provider. See Growth Engine.Leads
All leads, both referred and self-generated. See Growth Engine.Employer Services
Workers’ compensation and direct-to-employer patients and visits. See Growth Engine.Patient Experience
NPS survey results and kiosk check-in adoption. See Retention Engine.Outcomes
Functional outcome coverage at evaluation, progress note, and discharge, plus score change and MCID when grouped by measure. See Retention Engine.Retention
Discharge quality, lost patients, and authorization, plan-of-care, and script follow-up. See Retention Engine.Productivity
Clinical hours, visit counts, visits per hour, schedule utilization, and FTE-normalized productivity. See Efficiency Engine.Billing Quality
Procedure unit mix, evaluation complexity, non-billable leakage, and codes per visit. See Efficiency Engine.Performance Pdo
Composite per-provider performance across experience, productivity, arrival, and documentation. See Efficiency Engine.Visits Summary
Total visits, active patients, new patients, and discharged patients. See Report Categories.Visits Per Fte Per Day
Visit volume against provider FTE and calendar days. See Report Categories.Chart Note Time To Completion
Average, minimum, and maximum hours from appointment start to a signed chart note. See Report Categories.Scribe Notes
Total notes, scribe-assisted notes, and the resulting adoption rate. See Report Categories.Referrals Over Time
Total, refused, and accepted referrals as a time series. See Report Categories.Referral Scheduled Rate
How many referrals convert into scheduled appointments. See Report Categories.Referrals By Source
Referral counts by source type, referring provider, or insurance company. See Report Categories.Leads By Stage
Leads broken out one row per configured lead stage. See Report Categories.Capacity
Booked time against available working time, as a filled-capacity ratio. See Report Categories.Scheduling Metrics
Raw appointment counts by status. See Report Categories.NPS Summary
Promoters, passives, detractors, NPS score, and average rating. See Report Categories.NPS Response Rate
What share of completed visits produced a survey response. See Report Categories.Key terminology
Some EHR Reports metrics share a name with a card on the Performance Analysis KPI dashboard, such as Arrival Rate, Scheduled Patients, and Underscheduled Patients. They are separate surfaces with their own calculations. The definitions in this section describe EHR Reports metrics only; see Review your KPI Dashboard for the dashboard’s versions.